Group Abstract Group Abstract

Message Boards Message Boards

Graphing a Mandelbulb with Wolfram Language

Posted 11 years ago

Hello!

I am new with Mathematica and I am constructing a Mandelbulb fractal with Mathematica but when I Graph it, it won't graph it as how other websites show the Mandelbulb. Let me give you some examples:

These are with power=8:

enter image description here

enter image description here

These are with power=2:

enter image description here

enter image description here


CODE

Mandelbulb[c_] := 
 Module[{o = 1, n = 8, newx = x, newy = y, newz = z, 
   r = Sqrt[x*x + y*y + z*z]},
         While[o < 400 &&
             r <= 2,
   theta = ArcTan[Sqrt[newx*newx + newy*newy], newz];
   phi = ArcTan[newy, newx];
   newx = r^n*Sin[theta*n]*Cos[phi*n] + x;
   newy = r^n*Sin[theta*n]*Sin[phi*n] + y;
           newz = r^n*Cos[theta*n] + z;
   r = Sqrt[newx*newx + newy*newy + newz*newz];
                  o = o + 1];
                   o]
DensityPlot3D[Mandelbulb[x + y*I], {x, -1.5, 1.5}, {y, -1.5, 1.5}, {z, -1.5, 1.5}]

My guess is that I am using DenityPlot3D and I can be using a better graphing command

Thank you very much for your time!!!

POSTED BY: Eduardo Carrera
5 Replies
POSTED BY: Roger L. Bagula
Posted 11 years ago

Thank you very much!!

That is exactly what I wanted, May you explain the code more deeply? I am doing this work just to practice and learn more about Mathematica.

Cheers!

POSTED BY: Eduardo Carrera

If you run my code with 300 points in each directions:

n = 300;
pts = Subdivide[-1.5, 1.5, n];
AbsoluteTiming[vals = ParallelTable[cf[x, y, z], {x, pts}, {y, pts}, {z, pts}];]
Times @@ Dimensions[vals]
ListContourPlot3D[vals, Contours -> {20}, Mesh -> None]

enter image description here

you will see some more details...

POSTED BY: Sander Huisman

It seems to me it need to be pixels or voxels for better resolution control. While this is done with GPU:

Generate a Mandelbulb Set with CUDA Functionality

the final rendering function is 2D and is just Image

enter image description here

I think the same was used in this video:

Fractals in Mathematica with OpenCL

enter image description here

so they sort of compute a 2D projection and guarantee a high res image.

POSTED BY: Sam Carrettie

I'm not sure if Mathematica is the right tool to make these plots, but well we can try. First we can compile and optimize your code a bit:

ClearAll[cf,cfg]
cf=Compile[{{x, _Real},{y, _Real},{z, _Real}},
    Module[{o=1,n=8,newx=x,newy=y,newz=z,rsq=x x+y y+z z,theta,phi},
        While[o<400&&rsq<=4,
            If[newz==0.0,newz=0.000001];
            If[newz==0.0,newx=0.000001];
            If[newy==0.0,newy=0.000001];
            theta=n ArcTan[Sqrt[newx*newx+newy*newy],newz];
            phi=n ArcTan[newy,newx];
            rsq=rsq^(n/2);
            newx=rsq Sin[theta]Cos[phi]+x;
            newy=rsq Sin[theta]Sin[phi]+y;
            newz=rsq Cos[theta]+z;
            rsq=newx newx+newy newy+newz newz;
            o=o+1
        ];
    o
    ]
]
cfg[x_?NumberQ,y_?NumberQ,z_?NumberQ]:=cf[x,y,z]

Compared to your uncompiled version it is 11x faster:

RepeatedTiming[Mandelbulb[0.1, 0.1, 0.1], 2]
RepeatedTiming[cf[0.1, 0.1, 0.1], 2]
RepeatedTiming[cfg[0.1, 0.1, 0.1], 2]
0.0056
0.00052
0.00053

on my machine...

n = 45;
pts = Subdivide[-1.5, 1.5, n];
AbsoluteTiming[
 vals = Table[cf[x, y, z], {x, pts}, {y, pts}, {z, pts}];]
Times @@ Dimensions[vals]
ListContourPlot3D[vals, Contours -> {20}, Mesh -> None]

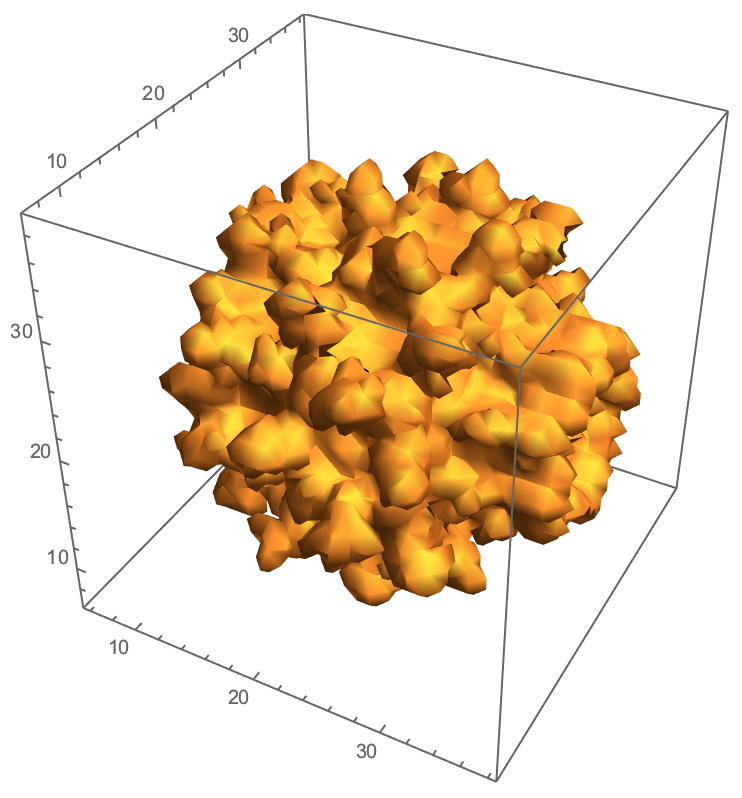
Now we use ContourPlot rather than DensityPlot to get a surface:
enter image description here

With already a much better result, and only in 4 seconds (my laptop). Again, I'm not sure if Mathematica is the right tool, but with some optimisations it might be possible.

POSTED BY: Sander Huisman
Reply to this discussion
Community posts can be styled and formatted using the Markdown syntax.
Reply Preview
Attachments
Remove
or Discard