Hello Kristian,
Here is an example that I think is useful for understanding parameterized vectors and surfaces.
Here is a surface---it takes two parameters and gives you back a single vector in 3D:
surface[{u_, v_}] := {Cos[u] Sin[v], Cos[v] + Sin[u], Sin[u] Sin[v]}
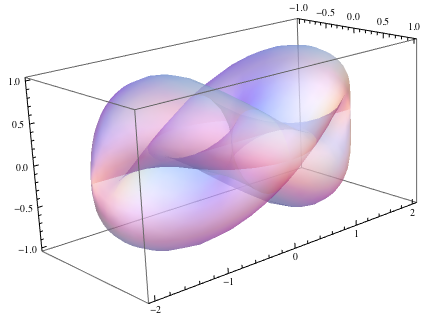
Here is a graphical representation of that surface:
surfaceGraphic = ParametricPlot3D[surface[{u, v}], {u, 0, 2 Pi}, {v, 0, 2 Pi}, PlotStyle -> Opacity[0.5], Mesh -> False]

Here is a curve, it is just a simple circle; it takes one parameter and gives you a point in two dimensions.
curve[t_] := {Cos[t] , Sin[t]}
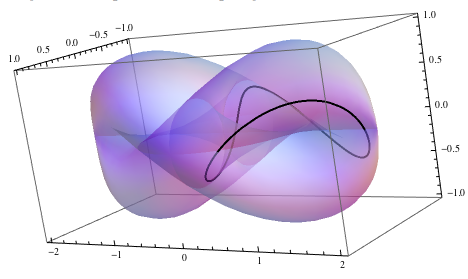
Let's embed the curve on the surface. We will let the curve (i.e, vectors) play the role of u and v on the surface:
curveGraphic = ParametricPlot3D[surface[curve[t]], {t, 0, 2 Pi}, PlotStyle -> Thick]
Let's put those together:
Show[surfaceGraphic, curveGraphic]

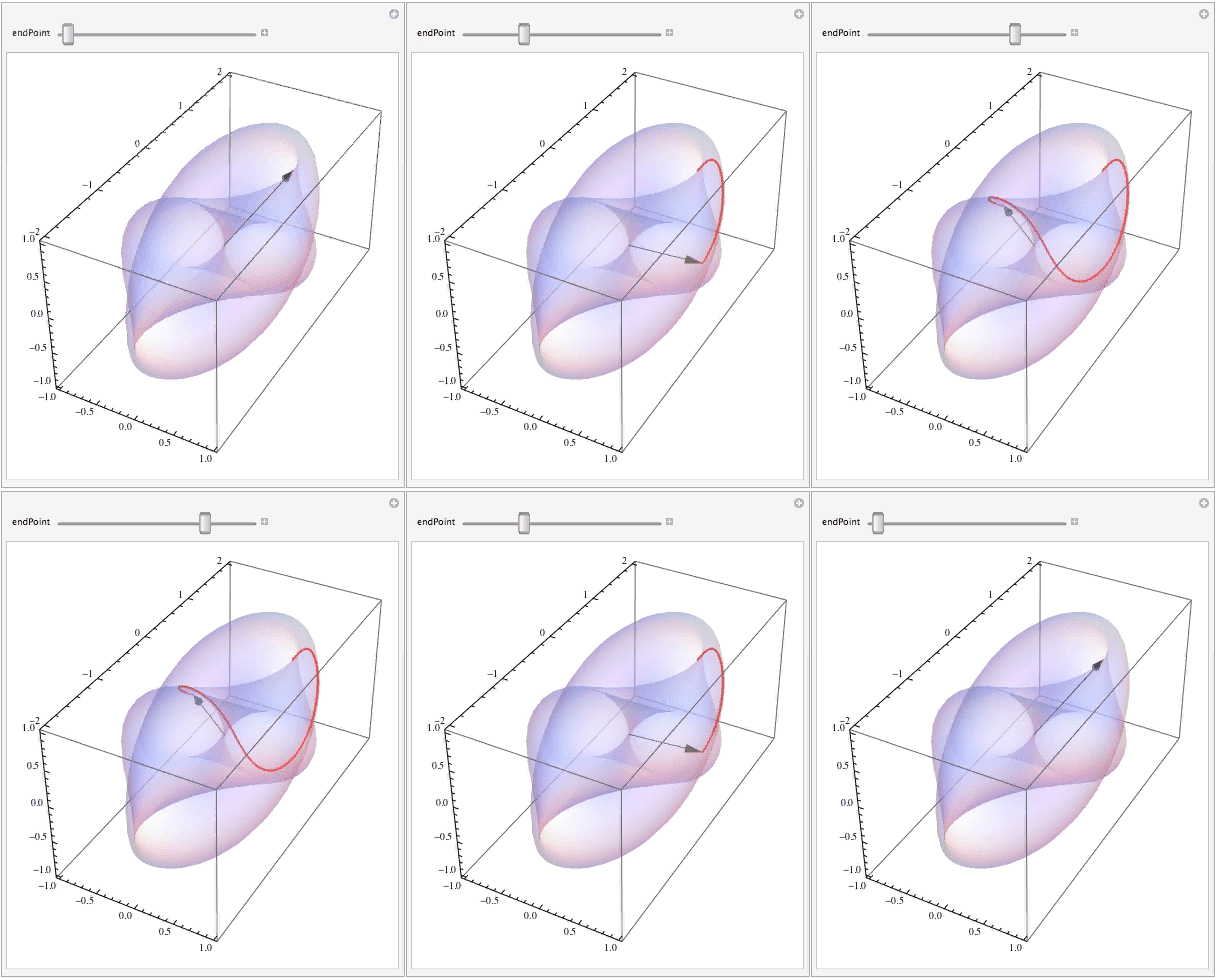
Finally, let's see how the curve (i.e., your parameterized vector) moves along its trajectory as the parameter changes:
Manipulate[ Show[surfaceGraphic, ParametricPlot3D[surface[curve[t]], {t, 0, endPoint}, PlotStyle -> { Thick, Red}], Graphics3D[{Black, Arrow[Tube[{{0, 0, 0}, surface[curve[endPoint]]}, .005]]}]], {{endPoint, Pi}, 0.0001, 2 Pi} ]

Have some fun and change the surface and the curve!
Craig