Message Boards Message Boards

0
|
6586 Views
|
3 Replies
|
8 Total Likes
View groups...
Share
Share this post:

Plots of solution of second order ODE not for my initial conditions

Posted 12 years ago
Hi,

I was working on problem 244 from Taylor: Classical Mechanics (trajectory of a steel ball, taking into account air resistance varying with height) and wanted to solve it numerically to get some nice plots.
This is what I gave Wolfram Alpha as input:
y''(x) = -9.81 - 0.0004 * exp(-y(x)/10000) * y'(x)^2, y(0)=0, y'(0)=229.8 for x from 0 to 10

Now, the output contains only plots for the cases y(0) = 1, y'(0) = 0 and y(0) = 0, y'(0) = 1 which is different of my chosen initial values. How can I specify the initial values in such a way that a plot for the corresponding solution is generated?

Regards
José
POSTED BY: José D.S.
3 Replies
Hey Jose, 

You may try this query to get numeric results, including not only the plot but also the detailed error analysis
solve {y''(x) = -9.81 - 0.0004 * exp(-y(x)/10000) * y'(x)^2,y(0)=0, y'(0)=229.8} from 0 to 10 using r k f algorithm
A more detailed list of valid input could be retrieved from the WA example page: 

http://www.wolframalpha.com/examples/NumericalDifferentialEquationSolving.html

Hope this answers your question. 

Have fun!
POSTED BY: Shenghui Yang
Hello Jose,

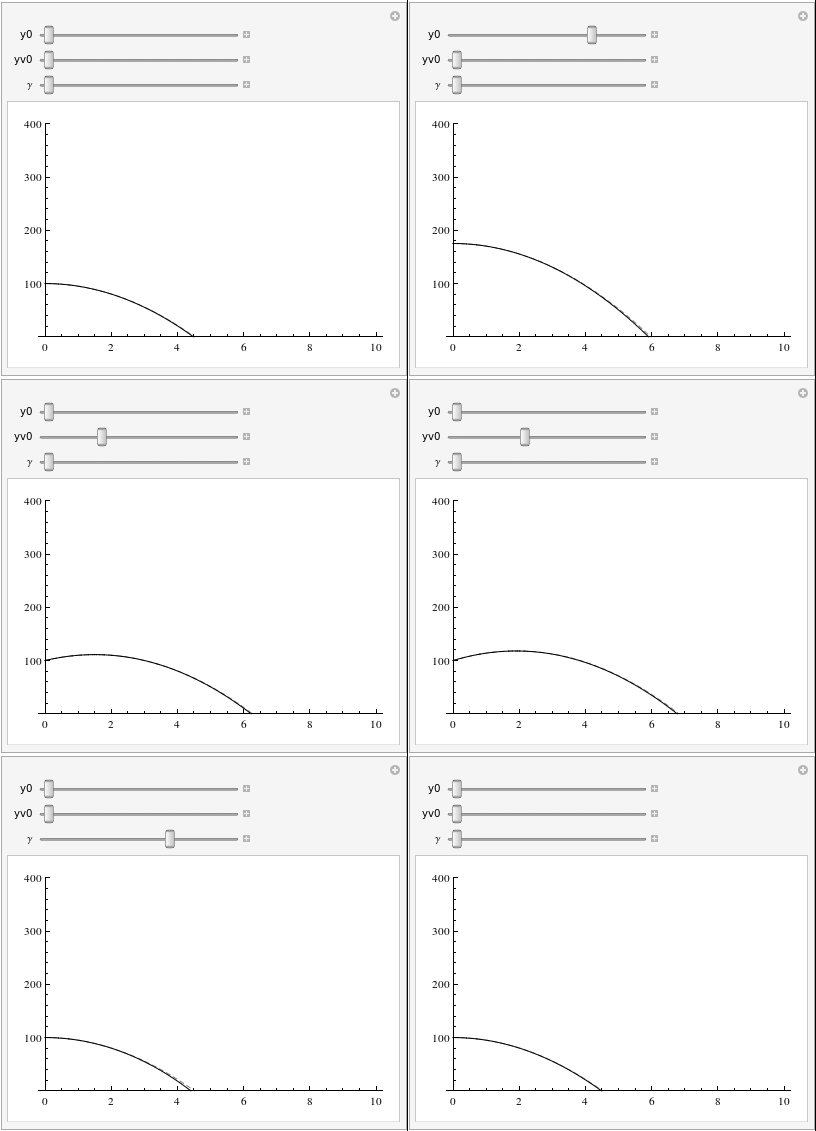
You might also want to look into using Mathematica itself to perform your calculations.  There is a new in 9 function called ParametricNDSolveValue which you might find particularly useful.   For example:
sols = ParametricNDSolveValue[{y''[x] == -9.81 - \[Gamma] Exp[-y[x]/10000] (y'[x])^2, y[0] == y0,
    y'[0] == yv0}, y, {x, 0, 10}, {y0, yv0, \[Gamma]}];

This will allow you to sweep through parameters.  From here it is a quick jump to create an interactive graphic where you can control the inital potision, velocity, and drag coefficient.   The Manipulate below shows the effect of air resistance by comparing to the ideal case where gamma is 0 (dashed line).  
Manipulate[Plot[{sols[y0,yv0,0][x],sols[y0,yv0,\[Gamma]][x]},{x,0,10}, PlotRange-> {0,400}, PlotStyle->{Directive[Gray, Dashed],Black}],{y0,100,200},{yv0,0,50},{\[Gamma],0.0004,0.002}]
POSTED BY: Jesus Hernandez
Posted 12 years ago
Hi Yang,

thank you for your clarification, it worked beautifully!
I thought a numerical algorithm would be chosen automatically, but I was wrong.

Cheers
José
POSTED BY: José D.S.
Reply to this discussion
Community posts can be styled and formatted using the Markdown syntax.
Reply Preview
Attachments
Remove
or Discard

Group Abstract Group Abstract