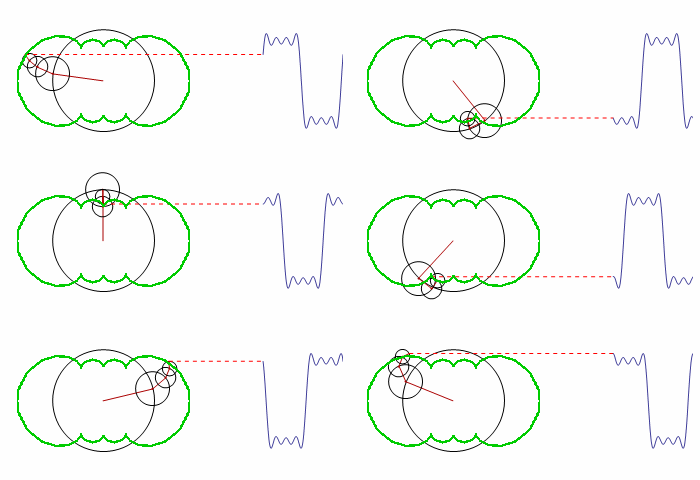
How can the green contour be graphed?

FourierF[a_, t_] := a.Table[Sin[ 2 Pi i t], {i, Length[a]}];

FourierAnim[a_, t_] :=
  Module[{
    A = Accumulate[a*Table[Cos[ 2 Pi i t], {i, Length[a]}]],
    B = Accumulate[a*Table[Sin[2 Pi i t], {i, Length[a]}]]},
   PrependTo[A, 0]; PrependTo[B, 0];
   Show[
    Graphics[
     Table[
      {Circle[{A[[i]], B[[i]]}, a[[i]]],
       Darker[Red],
       If[i != Length@a,
        Line[{{A[[i]], B[[i]]}, {A[[i + 1]], B[[i + 1]]}}],
        {Red, Dashed, Line[{{A[[i]], B[[i]]}, {2, B[[i]]}}]}]

       (* next line needs to be fixed *)
       , {Green, Line[Table[{m, n}, {m, A[[i]], t}, {n, B[[i]], t}]]}
       (* end of section needing editing *)

       },
      {i, Length@a}
      ],
     PlotRange -> {{-1.5, 3}, {-1, 1}}
     ],
    Plot[FourierF[a[[;; -2]], t - \[Tau]], {\[Tau], 2, 3}]
    ]
   ];

a = Table[(1 - (-1)^i)/i, {i, 64}]/Pi;
(* (1+(-1)^i)/i,{i,65} for sawtooth wave *)
(* ??? for triangle wave *)

Manipulate[
 FourierAnim[
  a[[;; j]], t], {t, 0, 1}, {j, 8, Length@a, 2}
 ]
(* {t,0,0.5},{j,9,Length@a,2} for sawtooth wave *)
(* ??? for triangle wave *)
The code is a modified version of the original; it demonstrates how the smooth motion of rotating circles can be used to build up any repeating curve.
The eventual solution was suggested by someone else as result of conversating on the topic:
Can you make a list of the points and use Line? You seem to be able to calculate the points at each time (in order to draw the figure). Just make a Table of them over one period with suitable increment of time.
One of the early attempts of coding this was left uncommented, because it is the only one that produced visible related results. I now understand the error in Table and the array it generates, but this example is perfect for showing the confusion of a beginner. The solution will help me a lot in learning through examples.
Additional question:
What exactly needs to be changed in the formula 1-(-1)^i)/i in order to make (an approximation of) a triangle wave?
Thank you in advance for your help, it is much appreciated!