Message Boards Message Boards

Record evenly spaced out points around the perimeter of an image?

I am very new to this software so I unfortunately do not have any examples I could show to represent what I am trying to do. Basically, I am adopting a geometric morphometric approach to determine the sex of a juvenile from the ilium (hip bone). The bones have been photographed in 2 different views, one of the flat surface of the bone and one of the crest of the bone. For the method I am following, I would need to be able to record evenly spaced out points around different parts of the bone, most importantly around the perimeters. It is important that they are evenly spaced, and this is what I am struggling with since I am not too familiar with the software. The numbers of points are mainly 50 or 100 depending on location. Is this possible to do with Mathematica? I know I can do the eigenshape analysis on the software which is what I will use to create discriminant functions. I have included an image as an example, and for that specific image the points would need to go all around the edge of the bone. Also, I would need to be able to record the angle of the greater sciatic notch (the large notch at the top left of the bone), is there a way of doing this on the software as well? For that the original method placed 3 points down at specific locations, but of course it does not have to be done that way if there are other valid ways. Thank you very much in advance to anyone who may be able to help or give some advice on this matter!

Photo of ilium

12 Replies

I have finally found a way to calculate functions for the curvatures of the iliac crests. The best fit functions have come up as 5th polynomials. The next thing I need to now do is get some information on the errors of the fit of the function to the points. I saw that you can do this by using "ParameterTable" but it does not want to work for me (not sure if that is just because I do not know how to adapt it to my specific graph since the examples are of NonLinearModelFit.. So here is what I have so far:

poly5fit = Fit[pts, {1, x, x^2, x^3, x^4, x^5}, x]
560.117 - 1.64354 x + 0.00382779 x^2 - 3.93849*10^-6 x^3 + 
 1.98477*10^-9 x^4 - 3.87972*10^-13 x^5
Show[ListPlot[pts], Plot[poly5fit, {x, 0, 2000}]]

Polynomial function and points

I do not know how to go further to get any information out of this graph however and would greatly appreciate the help! I would like to know if I can somehow make "ParameterTable" work in this case, or anything to that effect. How can I go about this? The results that I can get would be something I can use to compare to other results of the same type just for different curves. Furthermore, what is the best and simplest way of comparing 36 functions like this to each other in order to produce a discriminant function that determines the sex of the specimen in question? Thank you very much!

The current entry from the Oxford Dictionary says: The plural of forum is usually spelled forums; the plural fora (as in the original Latin) is chiefly used when talking about a public square in an ancient Roman city.

POSTED BY: Frank Kampas

Here are some links to past fora discussions that describe ways to approximate derivatives given discrete numerical data.

1 2 3

Curvature approximations could be done as modest variants of these methods.

POSTED BY: Daniel Lichtblau

Thank you very much, I will have a look at those!

I have a few follow-up questions relating to this topic. I now need to be able to measure curvatures of different parts of the bone. Is this possible to do following the point recording? For example, I would need to measure the curvature of the iliac crest. How should I go about doing this, if it is possible to do on Mathematica? I have attached another image, in which I need to measure the curvatures of the top and bottom of the iliac crest. Also, is there a way of measuring angles? I need to measure the angle of the greater sciatic notch. Thank you very much!Iliac Crest

I would start by detecting the edge:

img=Import[.......];
img=ImagePad[img,{{-250,0},{0,0}}];
img=ColorNegate[Binarize[img,0.5]];
img=FillingTransform[img];
img=DeleteSmallComponents[img,1000];
img=MorphologicalPerimeter[img,CornerNeighbors->False];
pos=N@PixelValuePositions[img,1];
{len,ord}=FindShortestTour[pos];
pos=pos[[ord]];


{xdata,ydata}=Transpose[pos];

(* add any smoothing function here (like moving average of lowpass filter) *)
len=Length[xdata];
xpos=Interpolation[xdata,InterpolationOrder->3];
ypos=Interpolation[ydata,InterpolationOrder->3];
ParametricPlot[{xpos[t],ypos[t]},{t,1,len}]/. Line -> Arrow

resulting in:

enter image description here

Now we can calculate the distance between each two points:

lens={#+1,ArcLength[{xpos[t],ypos[t]},{t,#,#+1}]}&/@Range[0,len-1];
lens=Prepend[lens,{0,0.}];
lens[[All,2]]=Accumulate[lens[[All,2]]];
ListPlot[lens]

Resulting in:

enter image description here

Now inverting the function and evaluating some 'times':

inverselens = Reverse /@ lens;
inverselens = Interpolation[inverselens];
times = inverselens /@ Subdivide[1, Max[lens[[All, 2]]], 100];
Graphics[Point[Table[{xpos[t], ypos[t]}, {t, times}]]]

enter image description here

POSTED BY: Sander Huisman

Thank you very much for taking the time to reply, I will give this a go and see how it works!

I am not sure what level of uniformity you need, but here are some thoughts. Import image:

i = Import["https://wolfr.am/emNdJOkT"];

Check the size:

ImageDimensions[i]

{1288, 1024}

Perform a set of operation to get single-pixel-wide border:

iEdge = DeleteSmallComponents[Pruning[Thinning[
    Dilation[ColorNegate[Binarize[ImageTake[i, {1, -1}, {250, -1}]]], 2]]]]

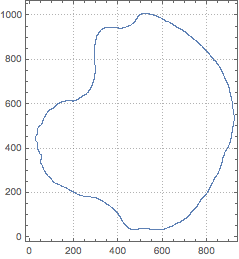
Get the coordinates of the pixels and sort them in the order that goes along the border:

pts = #[[FindShortestTour[#][[2]]]] &@PixelValuePositions[iEdge, 1];
ListPlot[pts, AspectRatio -> Automatic, PlotTheme -> "FrameGrid"]

enter image description here

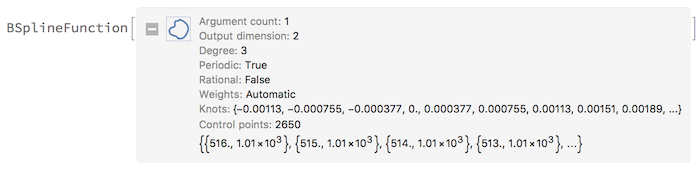
You could stop here, because perhaps this is uniform enough? If not you can a get true uniformity by getting analytic expression for the curve:

spln = BSplineFunction[pts]

enter image description here

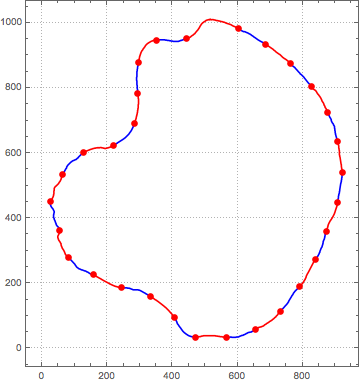
Then use a trick of automatic even mesh:

ParametricPlot[spln[t], {t, 0, 1},

 (*the trick*)
 Mesh -> 30,
 MeshFunctions -> {"ArcLength"},

 (*styles*)
 MeshStyle -> Directive[Red, PointSize[.02]],
 MeshShading -> {Red, Blue},
 PlotTheme -> "FrameGrid",
 AspectRatio -> Automatic]

enter image description here

You can get mesh coordinates as:

raw = ParametricPlot[spln[t], {t, 0, 1},
   Mesh -> 20,
   MeshFunctions -> {"ArcLength"},
   MeshStyle -> Red];
allPoints = Cases[raw, x_GraphicsComplex :> x[[1]], Infinity][[1]];
meshIndex = Cases[raw, {RGBColor[1, 0, 0], Point[x_]} -> x, Infinity][[1]];
allPoints[[meshIndex]]
POSTED BY: Vitaliy Kaurov

Definitely a nice solution using the MeshFunctions -> {"ArcLength"} option! I had no idea about that one! Thanks for sharing Vitaliy!

POSTED BY: Sander Huisman

Thank you so much for your detailed reply, I will have a go at that and see how it works, but it definitely looks like what I am going to need!

Evenly spaced as in angle from the center? or in distance along the perimeter?

POSTED BY: Sander Huisman

Evenly spaced as in distance along the perimeter, apologies for not clarifying that earlier!

Reply to this discussion
Community posts can be styled and formatted using the Markdown syntax.
Reply Preview
Attachments
Remove
or Discard

Group Abstract Group Abstract