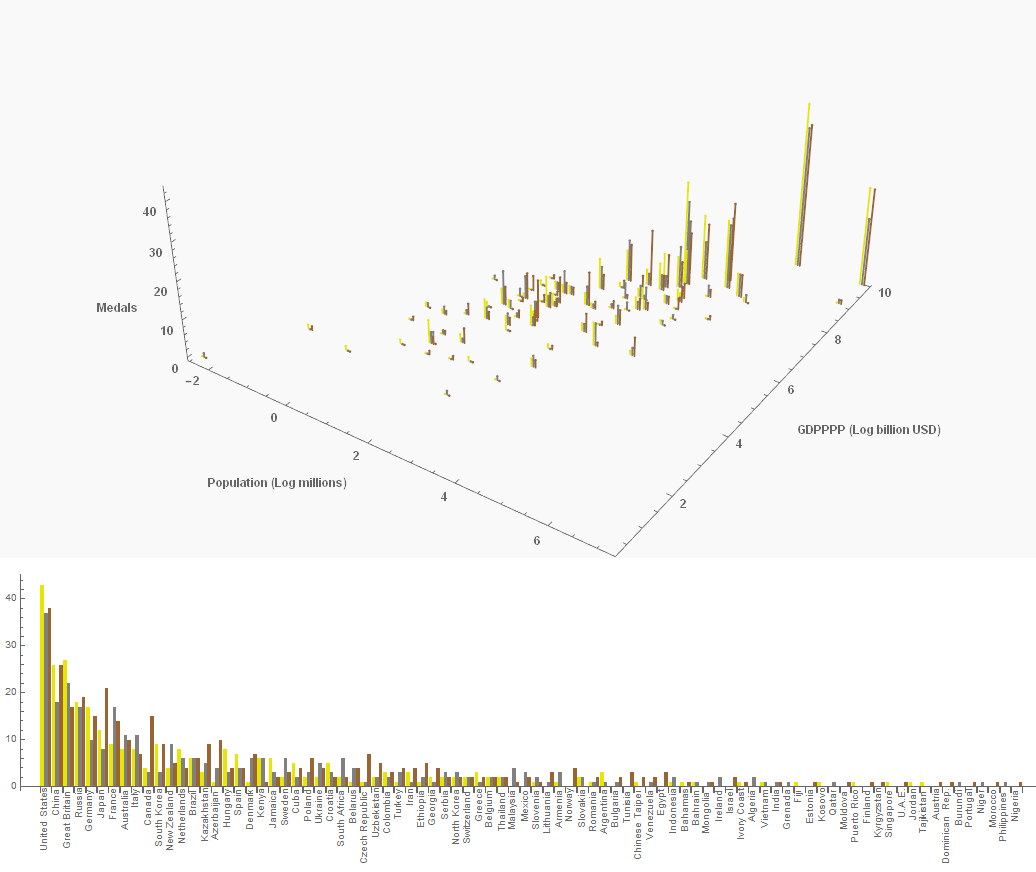
The Bloomberg Olympic medal counter features some great data on the wealth and population of the competing countries.
Whilst this is the best way to view the medal data, I struggle to get a sense of the relationship these metrics have with the medal counts.
I fired up Mathematica 11 to parse the Bloomberg html, and visualize their data.
It's a far cry from Zachary Littrell's fantastic breakdown by sport, but not bad for eleven lines of code!
CODE:
source = StringSplit[Import["C:\\Users\\user\\Desktop\\medalDat.txt"],"\n"];
data = Transpose[(StringSplit[#, ">"][[-1]] & /@
       StringSplit[#, "</td>"][[;; -2]]) & /@ source[[;; -2]]];
data = StringReplace[#, {"," -> "", "$" -> ""}] & /@ # & /@ data;
{names, gold, silver, bronze, total, pop, gdpppp, poprat, gdprat} = data;
graphTypes = {gold, silver, bronze};
graphStyles = {Darker[Yellow, 0.1], Gray, Brown};
graphOffsets = 0.05 {-1, 0, 1};
graphs = ListPointPlot3D[
     Transpose[{Log[ToExpression /@ pop] + #[[3]],
       Log[ToExpression /@ gdpppp], ToExpression /@ #[[1]]}],
     Filling -> Axis, PlotRange -> All, FillingStyle -> Thick,
     PlotStyle -> #[[2]], Boxed -> False,
     Background -> Lighter[Gray, 0.95],
     AxesLabel -> {"Population (Log millions)",
       "GDPPPP (Log billion USD)", "Medals"},
     LabelStyle -> Directive[Bold, Medium]] & /@
   Transpose[{graphTypes, graphStyles, graphOffsets}];
Show @@ graphs
BarChart[Transpose[ToExpression@{gold, silver, bronze}][[#]],
   ChartStyle -> graphStyles, ColorFunctionScaling -> False,
   ChartLabels -> {Rotate[#, \[Pi]/2] & /@ names[[#]], None}] &@
 Reverse[Ordering[ToExpression[total]]]
 Attachments:


