Message Boards Message Boards

US unemployment prediction from job-seeking websites traffic

US Unemployment Prediction

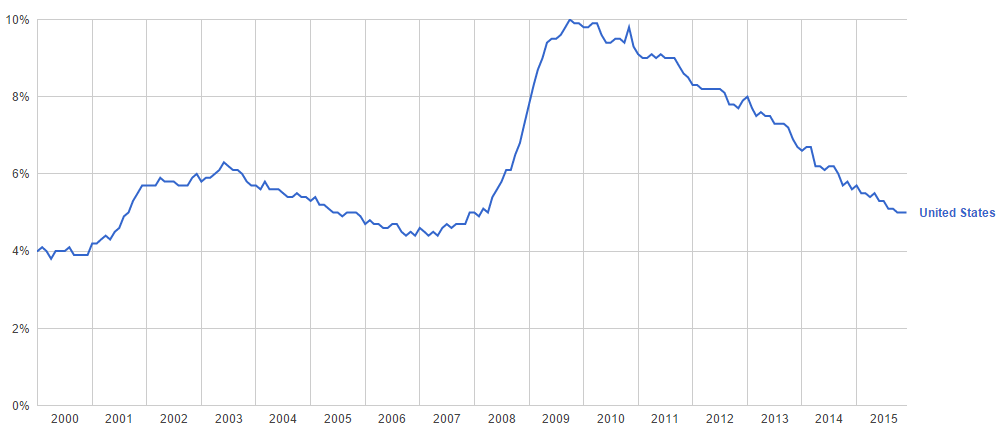
Like GDP, rate of employment illustrates the development and the strength of the economy. The Jobs Report is reported monthly by the U.S. Bureau of Labor Statistics and accounts for approximately 80% of the workers who produce the entire gross domestic product of the United States. The statistic is used to assist government policy makers and economists in determining the current state of the economy and in predicting future levels of economic activity.

Investors follow this number closely as well. The Jobs Report and unemployment rates are critical measures of an economy's overall health. Essentially, more people with jobs equates to higher economic output, retail sales, savings and corporate profits. As such, stocks generally rise or fall with good or bad employment reports, as investors digest the potential changes in these areas. As a result, these numbers have a strong effect on Stock Markets.(+)

So in this post, I want to develop a tool to predict this number before the official announcement, by having some job-seeking websites traffic as input data.

Gathering Data:

I thought that maybe job-seeking websites' daily visitors can be a good indicator for the unemployment rate. I found a list of websites, but Wolfram had the data for only 12 of them.

sites = {"indeed.com",
   "glassdoor.com",
   "monster.com",
   "simplyhired.com",
   "careerbuilder.com",
   "snagajob.com",
   "jobs.net",
   "ziprecruiter.com",
   "dice.com",
   "usajobs.gov",
   "snagaJob.com",
   "theladders.com"
   };
visitdata = 
  ParallelMap[
   WolframAlpha[StringJoin[#, " daily visitors"], "TimeSeriesData"] &,
    sites];
visitseries = TimeSeries[#] & /@ visitdata;

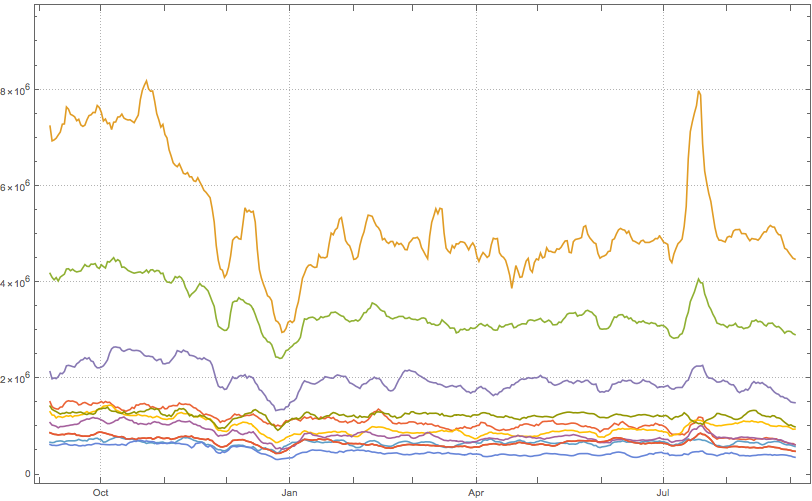
Here is a plot of daily visits for the sites in question:

DateListPlot[visitseries, PlotTheme -> "Detailed"]

enter image description here

Calculations:

Usually there is a weekly cycle in the traffic of every website, so it's better to consider all days of a week. I selected the average of visitors of the last week of every month as input.

visitShow[x_] := 
  N@QuantityMagnitude@visitseries[[#]][x] & /@ 
   Range[Length@visitseries];
(*This function shows the traffic of the websites in a specified day*)


Clear@input;
input = Transpose@
   Mean@Transpose@
     Thread[visitShow[
         DateObject[
           "Aug 29,2015"] + (Quantity[#, "Months"] & /@ 
            Range[0, 11]) + Quantity[#, "Days"]] & /@ Range[0, 6]];
(*This line gives back the mean of the traffics, in the last week of \
the months*)
unemploymentData = {8018., 7925., 7899., 7924., 7904., 7791., 7815., 7966., 
   7920., 7436., 7783., 7770.};
predictor = Predict[input -> unemploymentData , Method -> "NeuralNetwork"];
(*Data is for Aug 2015 till July 2016, provided by BLS.gov*)

Final Act:

Average visitors for the last two weeks was chosen as input, it also can be 1 or 3 weeks

predictor[
 Mean@Thread[
  visitShow[DateObject["Aug 26,2016"] - Quantity[#, "Days"] & /@ 
     Range[0, 13]]]]

August 26 isn't a special day, when I was writing this code, visit data was available till then :)

By the way, today BLS announced the official numbers: 7849 thousand unemployed in the US. This code had predicted 7852 ;)

all advice or helps in coding, predicting, data gathering or everything else, will be appreciated.

POSTED BY: Iman Nazari
9 Replies

Nice idea. I've added a graph to your post, - the more visualizations the better. I think you could have split your data on training set and test set. It would be interesting to see how well it performs on a few know values, not just one.

POSTED BY: Vitaliy Kaurov

Thank you Vitaliy. It seems much more interesting now. :-)

I had very limited values. I will consider it in the next versions that I use weekly stats and probably more traffic data.

POSTED BY: Iman Nazari

enter image description here - another post of yours has been selected for the Staff Picks group, congratulations !

We are happy to see you at the top of the "Featured Contributor" board. Thank you for your wonderful contributions, and please keep them coming!

POSTED BY: Moderation Team

You can get the data as

dataUSA = Entity["Country", "UnitedStates"][
   EntityProperty["Country", "CivilianUnemploymentRate", 
       {"Date" -> Interval[{DateObject[{1900}], Today}]}]];

DateListPlot[data, ImageSize -> Full, AspectRatio -> 1/4, PlotTheme -> "Detailed"]

enter image description here

POSTED BY: Sam Carrettie

Hi Sam. It's good. But data on wolfram database is outdated. (the latest stat is for 4-5 months ago)

But I'll appreciate it if you can help me about gathering websites traffic. I can do it only for the past year, but not more!

POSTED BY: Iman Nazari
Posted 8 years ago

Hi, Thank you for sharing this. It's a really cool and insightful approach. Wish I could help with advice about coding but I'm really just struggling to learn the most basic things in this program, having been working primarily with excel it is very challenging.

As far as the 'everything else', IMHO, If you want to have a pretty good idea what the NFP will be next month try some analysis on the weekly initial and continuing claims numbers; Please share any awesome analysis you come up with. I just use subtraction :-)

https://fred.stlouisfed.org/series/ICSA
https://fred.stlouisfed.org/series/CCSA

NFP moves the market due to 'smart money' entering and exiting strategic positions with the liquidity provided by 'dumb money' trading on that one 'magic' number that was actually totally predictable. Also,employment is a lagging indicator in itself, job searches would lag that, and crime as a last alternative would be say, an extremely lagging indicator.

To be clear NFP is an important indicator, but it is a lagging indicator. Anyway, sorry for the rant, hope it is at least a little thought provoking. If you'd ever like to discuss or collaborate on anything market related, like leading indicators, please let me know.

Kind regards, K.

POSTED BY: Kelly O

Hi Kelly, Thank you about the weekly stats, that will help me a lot.

Of course I am interested in discussing them. I'm looking forward to hear your advice. I'll consider any leading (or less lagging) indicator you may suggest.

POSTED BY: Iman Nazari

When I evaluate this notebook, I get this error:

"PredictorFunction::Incompatible variable type (NumericalVector) and variable value"

What is the output supposed to look like? I'm interested in neural networks, but I don't know much about them. Could we add additional variables?

POSTED BY: Tim Mayes

Oh. My bad! In the last line, there is a function named "f", it had to be visitShow. :|

You can change it or download the new version of the notebook ;)

The output is only a number (7853 in this case). but in other neural networks can be a class or number (or sth that I don't know)

Of course we can add new variables to it. (even if it is not like others. for example number of crimes committed!)

I'm not expert in neural networks also. I would be glad if anyone can suggest a suitable network to train.

POSTED BY: Iman Nazari
Reply to this discussion
Community posts can be styled and formatted using the Markdown syntax.
Reply Preview
Attachments
Remove
or Discard

Group Abstract Group Abstract