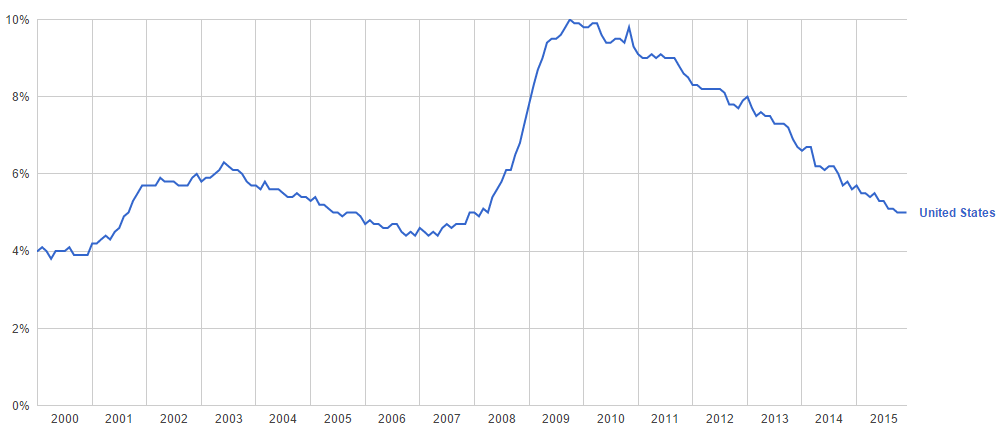
Like GDP, rate of employment illustrates the development and the strength of the economy. The Jobs Report is reported monthly by the U.S. Bureau of Labor Statistics and accounts for approximately 80% of the workers who produce the entire gross domestic product of the United States. The statistic is used to assist government policy makers and economists in determining the current state of the economy and in predicting future levels of economic activity.
Investors follow this number closely as well. The Jobs Report and unemployment rates are critical measures of an economy's overall health. Essentially, more people with jobs equates to higher economic output, retail sales, savings and corporate profits. As such, stocks generally rise or fall with good or bad employment reports, as investors digest the potential changes in these areas. As a result, these numbers have a strong effect on Stock Markets.(+)
So in this post, I want to develop a tool to predict this number before the official announcement, by having some job-seeking websites traffic as input data.
Gathering Data:
I thought that maybe job-seeking websites' daily visitors can be a good indicator for the unemployment rate. I found a list of websites, but Wolfram had the data for only 12 of them.
sites = {"indeed.com",
   "glassdoor.com",
   "monster.com",
   "simplyhired.com",
   "careerbuilder.com",
   "snagajob.com",
   "jobs.net",
   "ziprecruiter.com",
   "dice.com",
   "usajobs.gov",
   "snagaJob.com",
   "theladders.com"
   };
visitdata =
  ParallelMap[
   WolframAlpha[StringJoin[#, " daily visitors"], "TimeSeriesData"] &,
    sites];
visitseries = TimeSeries[#] & /@ visitdata;
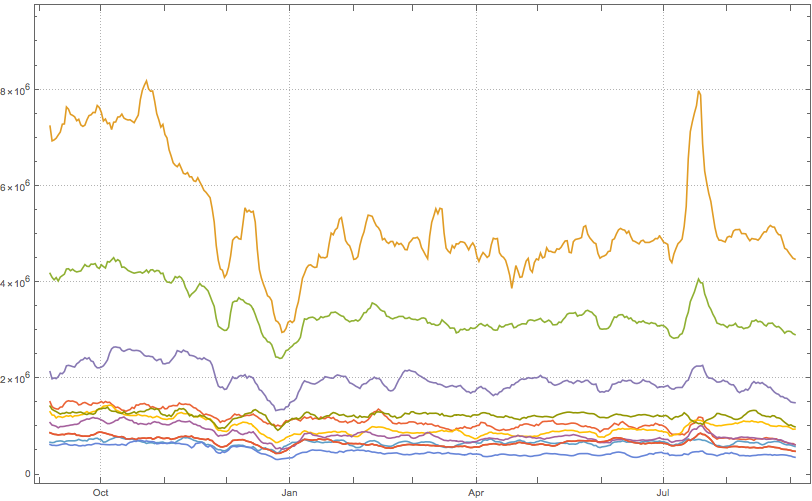
Here is a plot of daily visits for the sites in question:
DateListPlot[visitseries, PlotTheme -> "Detailed"]

Calculations:
Usually there is a weekly cycle in the traffic of every website, so it's better to consider all days of a week. I selected the average of visitors of the last week of every month as input.
visitShow[x_] :=
  N@QuantityMagnitude@visitseries[[#]][x] & /@
   Range[Length@visitseries];
(*This function shows the traffic of the websites in a specified day*)


Clear@input;
input = Transpose@
   Mean@Transpose@
     Thread[visitShow[
         DateObject[
           "Aug 29,2015"] + (Quantity[#, "Months"] & /@
            Range[0, 11]) + Quantity[#, "Days"]] & /@ Range[0, 6]];
(*This line gives back the mean of the traffics, in the last week of \
the months*)
unemploymentData = {8018., 7925., 7899., 7924., 7904., 7791., 7815., 7966.,
   7920., 7436., 7783., 7770.};
predictor = Predict[input -> unemploymentData , Method -> "NeuralNetwork"];
(*Data is for Aug 2015 till July 2016, provided by BLS.gov*)
Final Act:
Average visitors for the last two weeks was chosen as input, it also can be 1 or 3 weeks
predictor[
 Mean@Thread[
  visitShow[DateObject["Aug 26,2016"] - Quantity[#, "Days"] & /@
     Range[0, 13]]]]
August 26 isn't a special day, when I was writing this code, visit data was available till then :)
By the way, today BLS announced the official numbers: 7849 thousand unemployed in the US. This code had predicted 7852 ;)
all advice or helps in coding, predicting, data gathering or everything else, will be appreciated.