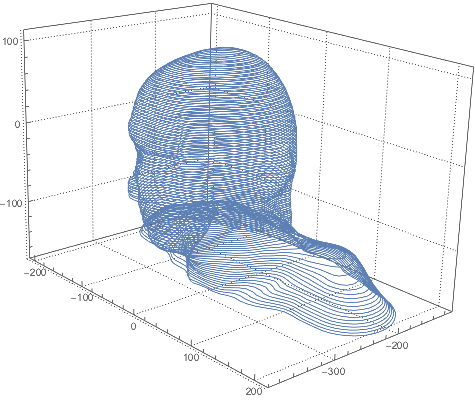
In addition to @Marco Thiel nice suggestions, I'd like to mention a possibility of resampling and building a spline surface. You have nice dense data. But number of points in each loop is different. A high resolution resampled 3D array of 3D points where number of points in each loop is the same could be your final output object. This could help 3D printing too. We start from creating a spline curve in 3D for every loop:
loopsBSF=BSplineFunction/@sliceData;
ParametricPlot3D[#[t]&/@loopsBSF,{t,0,1},
    PlotTheme->"Detailed",PlotLegends->None,PlotStyle->Thickness[0]]
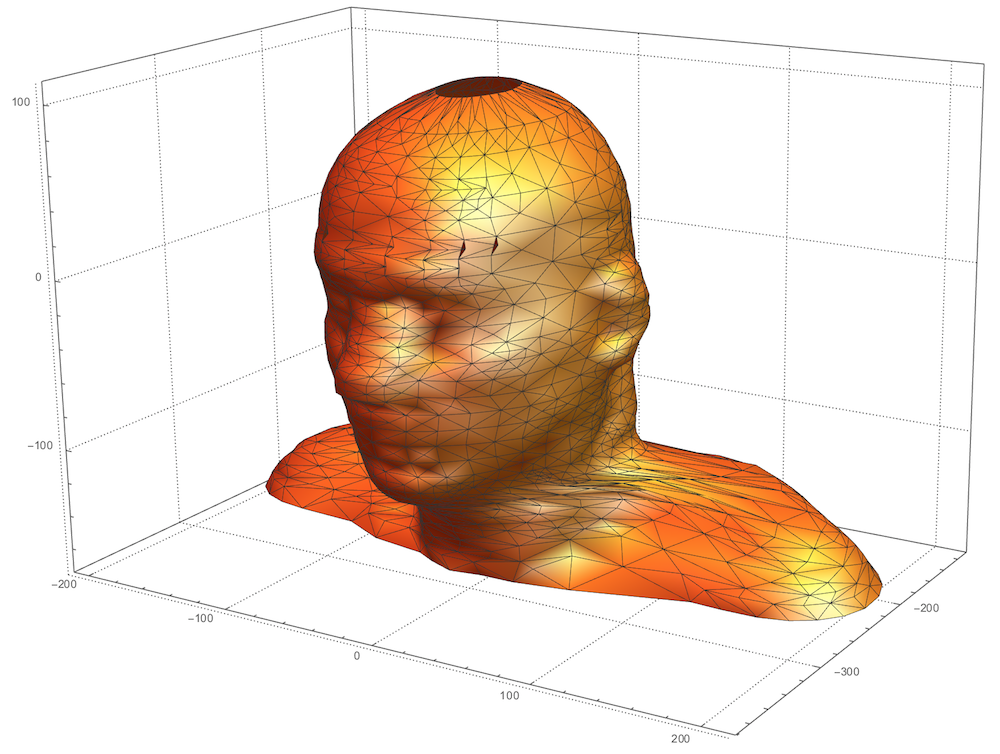
where the loops are already parametric spline functions and not data points. Now we build a higher resolution array with 1000 points per every loop and a spline surface:
higHreSdatA=Table[loopsBSF[[k]][t],{k,Length[sliceData]},{t,0,1,.001}];
surfBSF=BSplineFunction[higHreSdatA,SplineClosed->{False,True}]
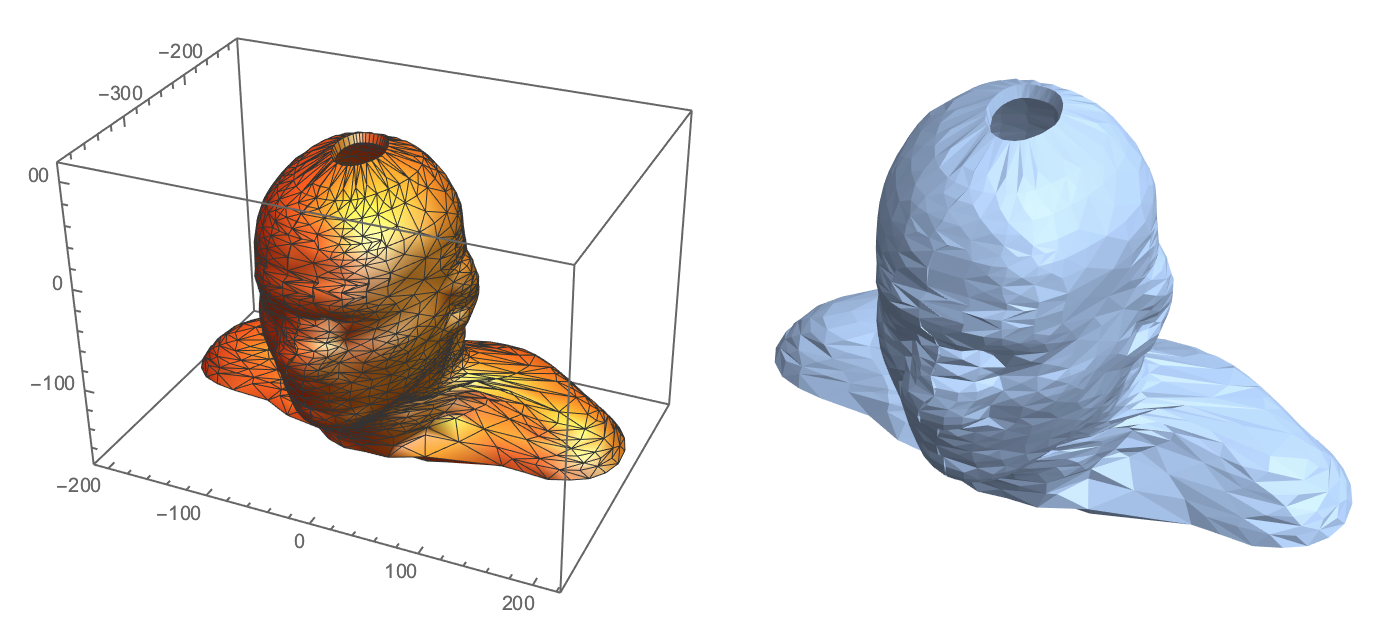
ParametricPlot3D[surfBSF[u,v],{u,0,1},{v,0,1},
PlotRange->All,Mesh->All,PlotStyle->{Orange,Specularity[White,10]},
SphericalRegion->True,PlotTheme->"Detailed",PlotLegends->None]
You can increase resampling generally for a higher resolution. You can also ask for surface thickness and make .STL file for 3D priniting:
ParametricPlot3D[surfBSF[u,v],{u,0,1},{v,0,1},
    PlotRange->All,Mesh->All,PlotStyle->{Orange,Specularity[White,10]},
    SphericalRegion->True,PlotTheme->"ThickSurface",PlotLegends->None]
Import[Export["test.stl",%]]
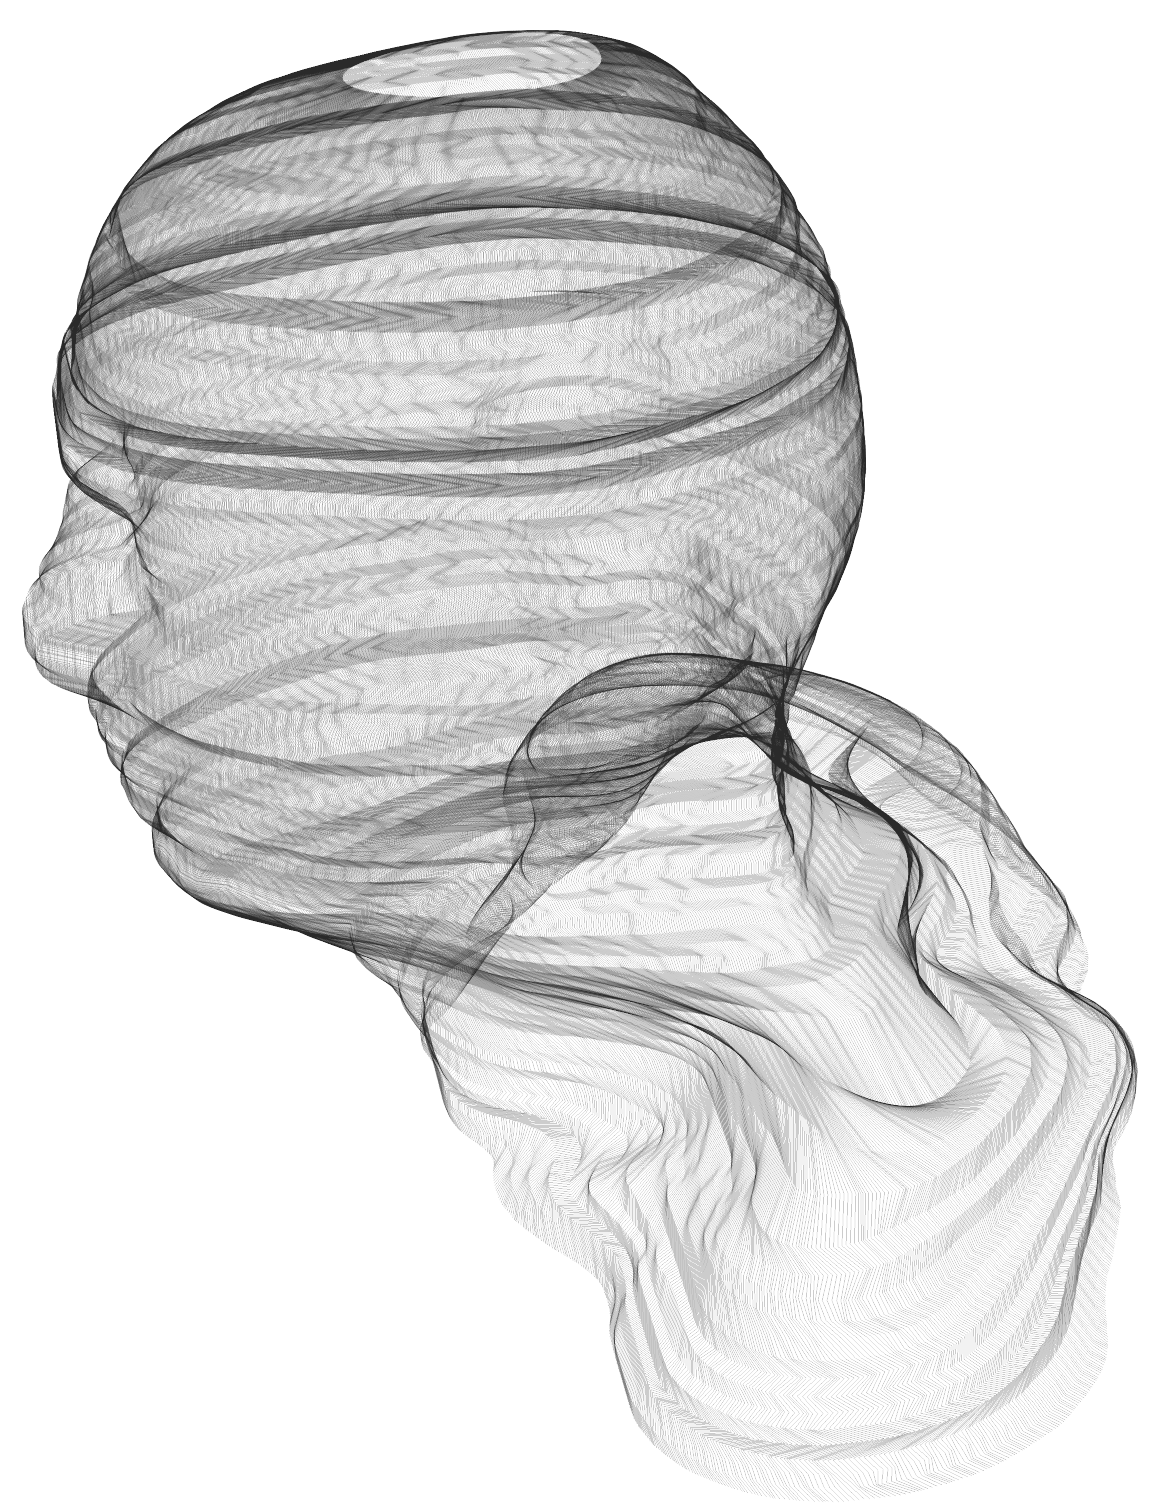
And this is object build now from only vertical lines - the new information derived from your data:
Graphics3D[{Opacity[.2], Line[Transpose[higHreSdatA]]}, Boxed -> False, SphericalRegion -> True]