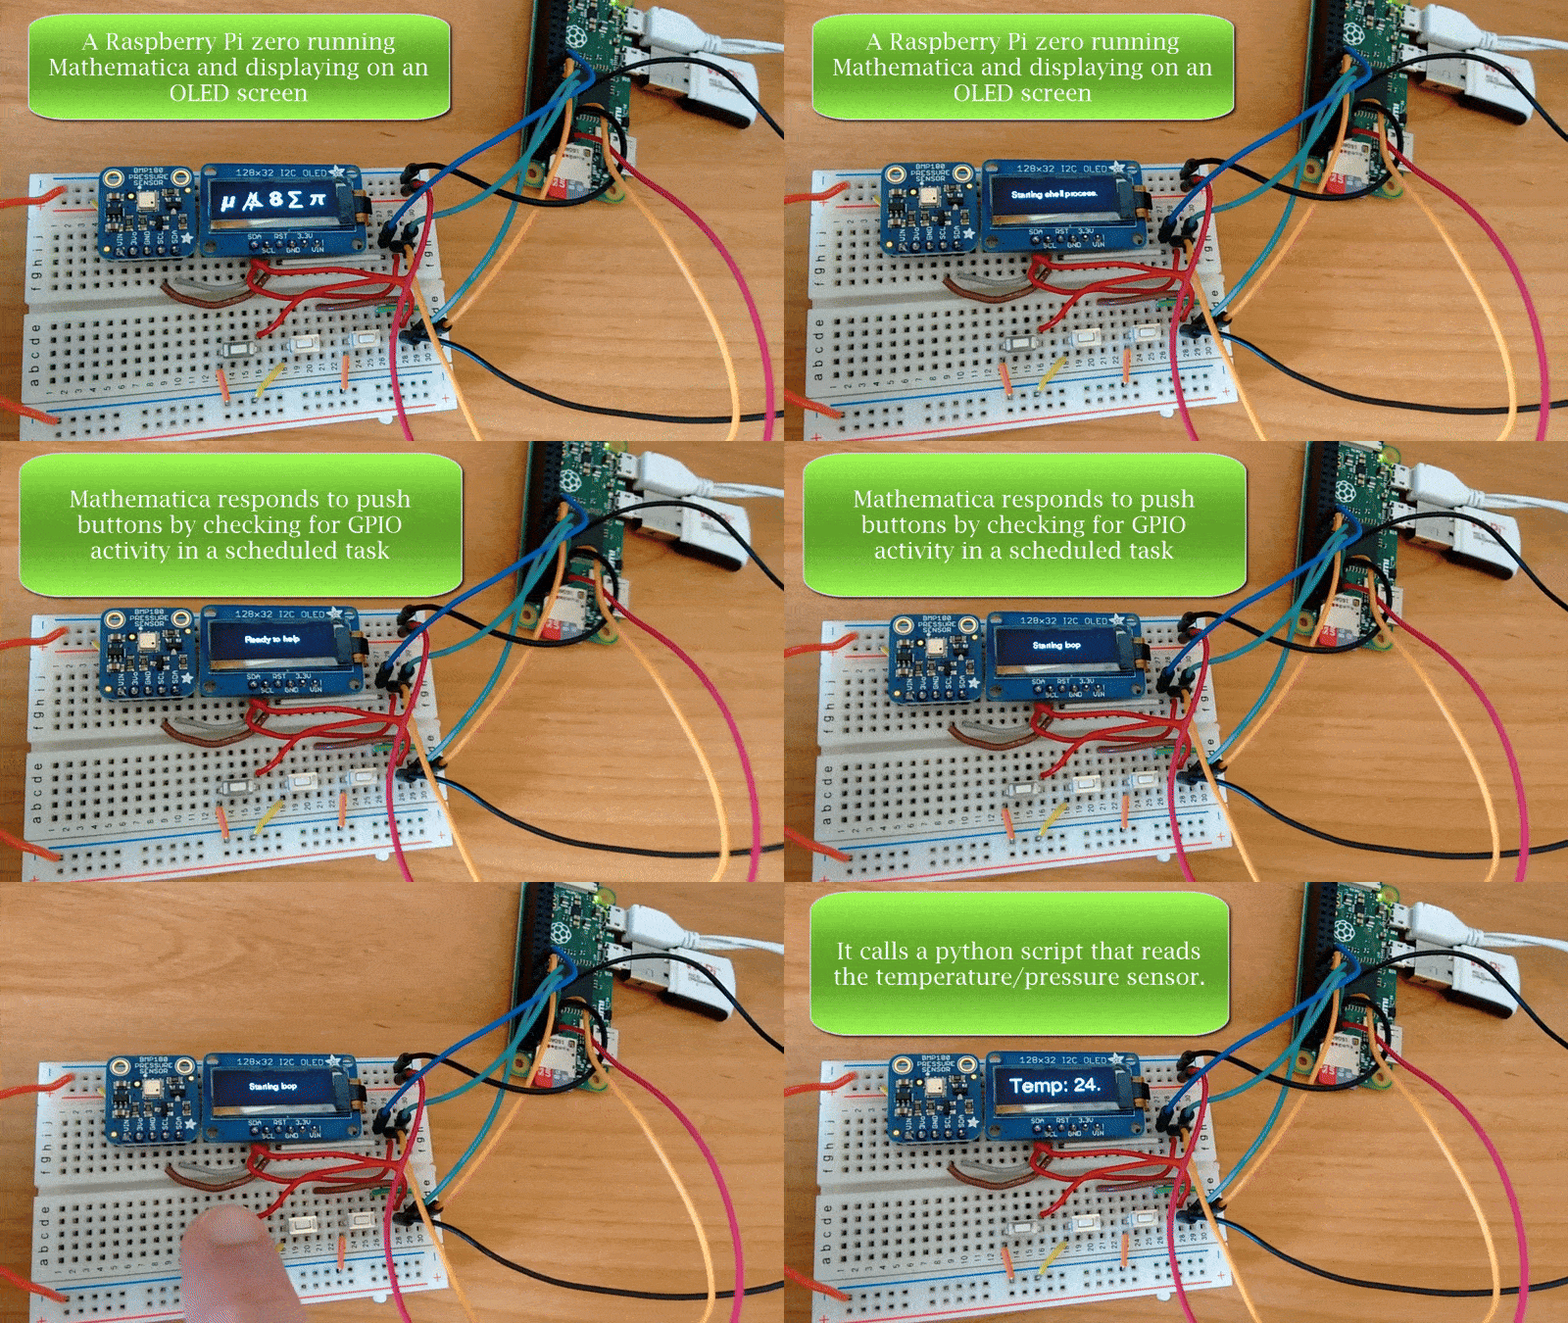
See full video here: https://youtu.be/3qVgLChQuYE

A few weeks ago, I started a small project involving a Raspberry Pi zero, a 1" OLED display, temperature/pressure sensor and Mathematica. It's functioning well enough now that I thought it would be instructive to walk through my design. I call it: microwolf. 
Project description
I'm interested in small, portable, low-cost sensor systems. Since Mathematica can run on a Raspberry Pi zero, I wanted to explore how far I can push this hardware/software combination. In building my first prototype, I am looking for the following characteristics:
- Display the output of a sensor numerically or graphically
- Doesn't require additional computer overhead (e.g. remote access via SSH)
- Responds to simple user interface
I've hit all of these points, with a package that I've made available on my github page.
The non-Mathematica stuff
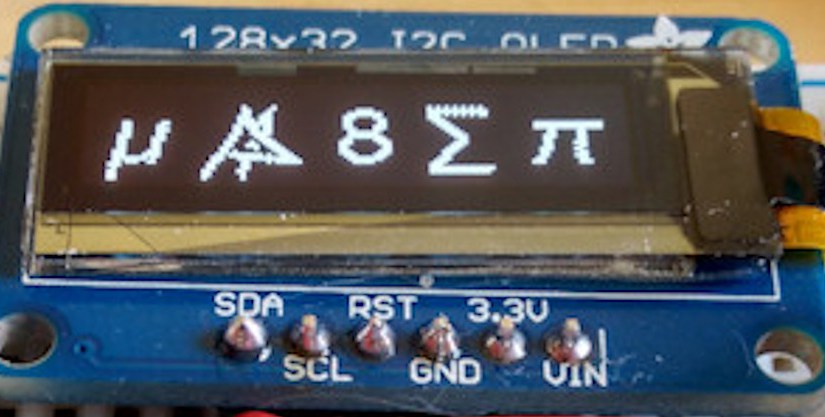
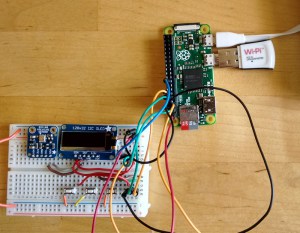
To get the project up and running, I rely on some python routines to interact with the OLED display and the Temperature/Pressure sensor, both of which were purchased from Adafruit and communicate with the RPi via the I2C interface. For the python code, I started with the Adafruit tutorials and paired them down to the bare bones needed for this project. For the sensor, that meant dumping the current temperature and pressure to standard output and for the OLED display, sending text or a pre-formatted image to the device. Here's what the hardware looks like:

You'll see the RPi zero with a WiFi dongle and power to the upper right and the sensor, display and three pushbuttons on the bread board. There's nothing fancy about the wiring here, I simply followed the Adafruit directions. The pushbuttons are connected to three free GPIO pins.
The Mathematica stuff
Displaying an image or text.
oledImage[img_] := Module[{},
  Export[$tempfile, img];
  Run[$oleddriver <> " --image " <> $tempfile ];
]
The process I'm using here is to export a graphic as a JPG to a temporary file, and then I use Run to execute the python scrip that displays an image.
oledText[str_String, style_:Smaller] := Module[{img},
  img = Graphics[{White, Text[Style[str,ReleaseHold@style],{1,0}]}, Background -> Black, ImageSize -> {128, 32}];
  oledImage@img;
]
Similarly, I convert any text into a graphic with proper formatting (in my case, the image must be 128x32 pixels, and the text should be white on black). oledText allows style information (Bold, FontSize, etc) to be passed along as well.
oledListPlot[data_, opts : OptionsPattern[ListPlot]]:= Module[{img, ticks},
  img = ListPlot[data, AspectRatio->0.15,ImageSize->{128,32},
    PlotStyle->{White,Thickness[0.01]}, FrameStyle->White, Background->Black,
    BaseStyle->{White,FontFamily->"Roboto",Bold,FontSize->8},
    Axes->False,Frame->{True,True,False,False},
    FrameTicks->{({{#1,DateString[#1,{"Hour",":","Minute"}]},
      {#2,DateString[#2,{"Hour",":","Minute"}]}})&,
      ({{#1,Round[#1]},{#2,Round[#2]}})&}];
  oledImage@img;
]
Above is an example of what needs to be done to make the plot look decent. There's still some tweaking to be done. In addition to setting styles and sizes, the FrameTicks are limited to just the axis extremes. Since the x-axis data is stored as AbsoluteTime I use a DateString to make it human readable.
GPIO setup
$shellprocess = StartProcess[$SystemShell];

WriteLine[$shellprocess, "gpio -g mode " <>  ToString@# <> " in"] & /@ validpins;
WriteLine[$shellprocess, "gpio -g mode " <>  ToString@# <> " up"] & /@ validpins;
ReadString[$shellprocess, EndOfBuffer];
GPIO setup is done with the gpio utility, which I believe is now packaged with the latest Raspian distributions. I open a shell and then set the GPIO pins connected to the pushbuttons as inputs with pullup resistors.
Scheduling
oledText["Starting datalog task"];
Put[{Now, bmpRead[]}, $datafile];
$datatask = RunScheduledTask[PutAppend[{Now,bmpRead[]},$datafile],30];

oledText["Starting interrupt task"];
$task = RunScheduledTask[readpins[], 0.5];
I use ScheduledTasks to do two things. First, the GPIO pins are going to be checked every 0.5 seconds to see if they have been pushed. If so, that information is recorded in a variable. Secondly, data readings are made every 30 seconds and stored in a text file, which helps to void memory problems.
Making it work
oledRun[] := Module[{},
  oledSetup[];
  oledLoop[];
  oledCleanup[];
]
Inspired by Arduino programming, I created three routines that constitute the "program". There's a setup routine that runs once and creates the temporary files, starts the scheduled tasks and welcomes the user. The loop runs indefinitely, waiting for pushbutton activity and otherwise updates the display with the latest data. The last step makes sure that tasks are stopped properly.
An important part to making this work without having to interact with the RPi via SSH or the keyboard was to create a script that will be run when the RPi boots. A number of Mathematica commands called in this program require the FrontEnd, so the RPi does boot to X and I added a line to ~/.config/lxsession/LXDE-pi/autostart to run this script:
SetDirectory['/home/pi/microwolf/'];
<<oled`
oledRun[]
Now, when I power on the RPi, it automatically logs in as the user Pi, starts X and runs the wolfram script that begins the sensor display. I've posted a short video showing an earlier version of the program. I don't have any decent images of the current version which has live updating of the sensor data in both numerical and graphical format (but it's working - trust me :-))
The future
This proof-of-concept design is working better than I expected. It takes about 5 minutes for the system to boot, load and start (no one expected Mathematica on a RPi zero to be anything but clunky). That said, there are several areas for improvement. I'd like to develop an I2C driver for Mathematica in order to bypass the python steps, and I am wasting resources by creating images of text. There are certainly tweaks to be made to the graphing, but I don't know if these are going to be aesthetic or speed (or both). In principle, I should be able to run this system from a battery, and even a solar panel. It's been cloudy in Chicago, though, so I have to wait for that part of the project.