Text and sentiment analysis has become a very popular topic in quantitative research over the last decade, with applications ranging from market research and political science, to e-commerce. In this post I am going to outline an approach to the subject, together with some core techniques, that have applications in investment strategy.
In the early days of the developing field of market sentiment analysis, the supply of machine readable content was limited mainly to mainstream providers of financial news such as Reuters or Bloomberg. Over time this has changed with the entry of new competitors in the provision of machine readable news, including, for example, Ravenpack or more recent arrivals like Accern. Providers often seek to sell not only the raw news feed service, but also their own proprietary sentiment indicators that are claimed to provide additional insight into how individual stocks, market sectors, or the overall market are likely to react to news. There is now what appears to be a cottage industry producing white papers seeking to demonstrate the value of these services, often accompanied by some impressive pro-forma performance statistics for the accompanying strategies, which include long-only, long/short, market neutral and statistical arbitrage.
For the purpose of demonstration I intend to forego the blandishments of these services, although many are no doubt are excellent, since the reader is perhaps unlikely to have access to them. Instead, in what follows I will focus on a single news source, albeit a highly regarded one: the Wall Street Journal. This is, of course, a simplification intended for illustrative purposes only in practice one would need to use a wide variety of news sources and perhaps subscribe to a machine readable news feed service. But similar principles and techniques can be applied to any number of news feeds or online sites.
The WSJ News Archive
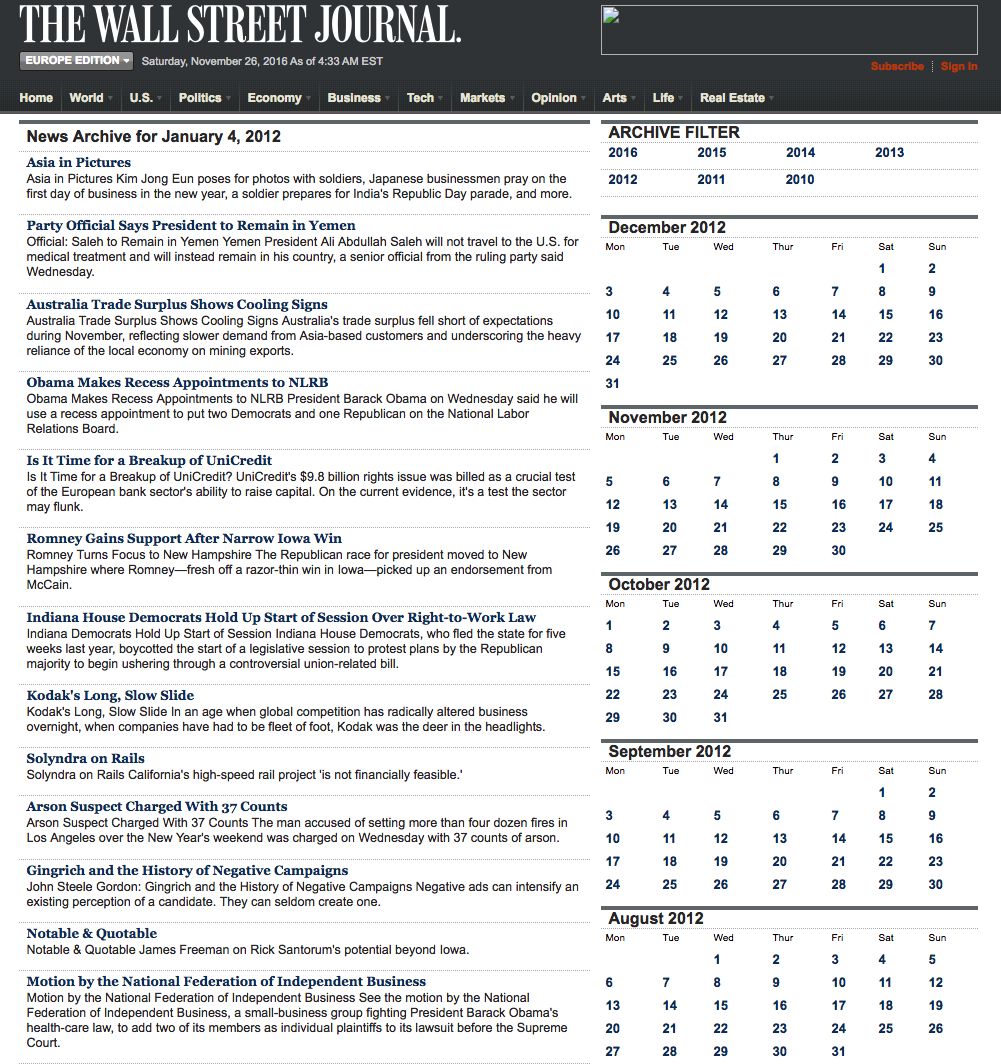
We are going to access the Journals online archive, which presents daily news items in a convenient summary format, an example of which is shown below. The archive runs from the beginning of 2012 through to the current day, providing ample data for analysis. In what follows, I am going to make a few important assumptions, neither of which is likely to be 100% accurate but which will not detract too much from the validity of the research, I hope. The first assumption is that the news items shown in each daily archive were reported prior to the market open at 9:30 AM. This is likely to be true for the great majority of the stories, but there are no doubt important exceptions. Since we intend to treat the news content of each archive as antecedent to the market action during the corresponding trading session, exceptions are likely to introduce an element of look-ahead bias. The second assumption is that the archive for each day is shown in the form in which it would have appeared on the day in question. In reality, there are likely to have been revisions to some of the stores made subsequent to their initial publication. So, here too, we must allow for the possibility of look-ahead bias in the ensuing analysis.
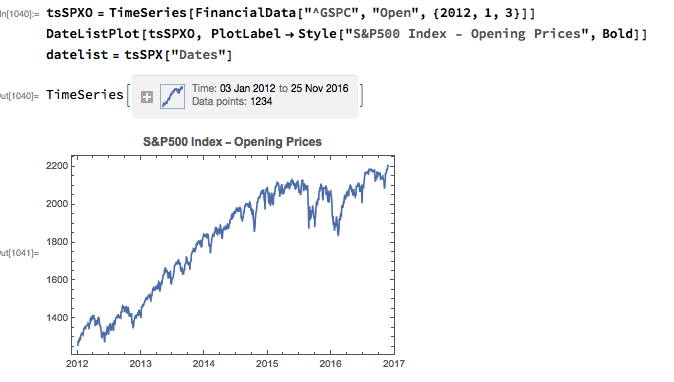
With those caveats out of the way, lets proceed. We are going to be using broad market data for the S&P 500 index in the analysis to follow, so the first step is to download daily price series for the index. Note that we begin with daily opening prices, since we intend to illustrate the application of news sentiment analysis with a theoretical day-trading strategy that takes positions at the start of each trading session, exiting at market close.
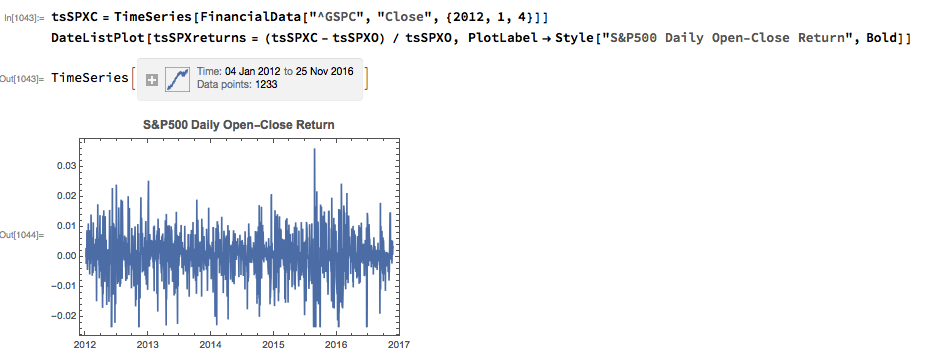
From there we calculate the intraday return in the index, from market open to close, as follows:
Text Analysis & Classification
Next we turn to the task of reading the news archive and categorizing its content. Mathematica makes the importation of html pages very straightforward, and we can easily crop the raw text string to exclude page headers and footers. The approach I am going to take is to derive a sentiment indicator based on an analysis of the sentiment of each word in the daily archive. Before we can do that we must first convert the text into individuals words, stripping out standard stop-words such as "the" and "in" and converting all the text to lower case. Naturally one can take this pre-processing a great deal further, by identifying and separating out proper nouns, for example. Once the text processing stage is complete we can quickly summarize the content, for example by looking at the most common words, or by representing the entire archive in the form of a word cloud. Given that we are using the archive for the first business day of 2012, it is perhaps unsurprising that we find that "2012", "new" and "year" feature so prominently!
archive =
  Import[StringJoin["http://www.wsj.com/public/page/archive-",
    DateString[
     datelist[[1]], {"Year", "-", "MonthShort", "-", "DayShort"}],
    ".html"]];
archive =
  StringDrop[archive,
   StringPosition[archive,
     DateString[
      datelist[[1]], {"MonthName", " ", "DayShort", ", ",
       "Year"}]][[1, 2]]];
archive =
  StringTake[
   archive, -1 + StringPosition[archive, "ARCHIVE FILTER"][[1, 1]]];
archivewords = ToLowerCase[DeleteStopwords[TextWords[archive]]];
TakeLargest[Counts[archivewords], 20]
WordCloud[archivewords]
<|"2012" -> 45, "new" -> 41, "year" -> 39, "u.s." -> 33, "2011" -> 21, "asia" -> 16, "iowa" -> 16, "crisis" -> 15, "biggest" -> 14, "news" -> 14, "markets" -> 14, "india" -> 13, "said" -> 13, "economic" -> 13, "market" -> 13, "oil" -> 13, "europe's" -> 13, "look" -> 12, "day" -> 12, "price" -> 12|>

The subject of sentiment analysis is a complex one and I only touch on it here. For those interested in the subject I can recommend The Text Mining Handbook, by Feldman and Sanger, which is a standard work on the topic. Here I am going to employ a machine learning classifier provided with Mathematica 11. It is not terribly sophisticated (or, at least, has not been developed with financial applications especially in mind), but will serve for the purposes of this article. For those unfamiliar with the functionality, the operation of the sentiment classification algorithm is straightforward enough. For instance:

We apply the algorithm to classify each word in the daily news archive and arrive at a sentiment indicator based on the proportion of words that are classified as "positive". The sentiment reading for the archive for Jan-3, 2012, for example, turns out to be 67.4%:

Sentiment Index Analytics
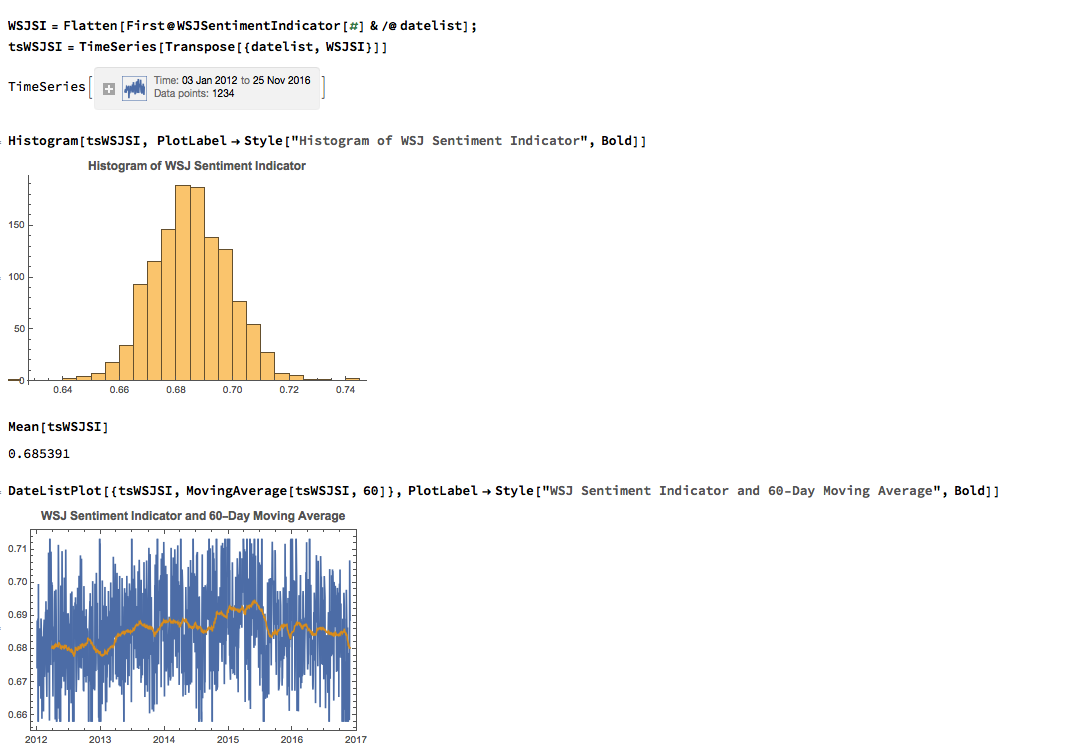
We can automate the process of classifying the entire WSJ archive with just a few lines of code, producing a time series for the daily sentiment indicator, which has an average daily value of 68.5% - the WSJ crowd tends to be bullish, clearly! Note how the 60-day moving average of the indicator rises steadily over the period from 2012 through Q1 2015, then abruptly reverses direction, declining steadily thereafter - even somewhat precipitously towards the end of 2016.
WSJSentimentIndicator[date_] :=
 Module[{d = date, archive, archivewords, WSJSI},
  archive =
   Import[StringJoin["http://www.wsj.com/public/page/archive-",
     DateString[d, {"Year", "-", "MonthShort", "-", "DayShort"}],
     ".html"]];
  archive =
   StringDrop[archive,
    StringPosition[archive,
      DateString[d, {"MonthName", " ", "DayShort", ", ", "Year"}]][[1,
      2]]];
  archive =
   StringTake[
    archive, -1 + StringPosition[archive, "ARCHIVE FILTER"][[1, 1]]];
  archivewords = ToLowerCase[DeleteStopwords[TextWords[archive]]];
  WSJSI = #Positive/(#Negative + #Positive) &@
     Counts[Classify["Sentiment", archivewords]] // N;
  {WSJSI, archivewords, archive}]
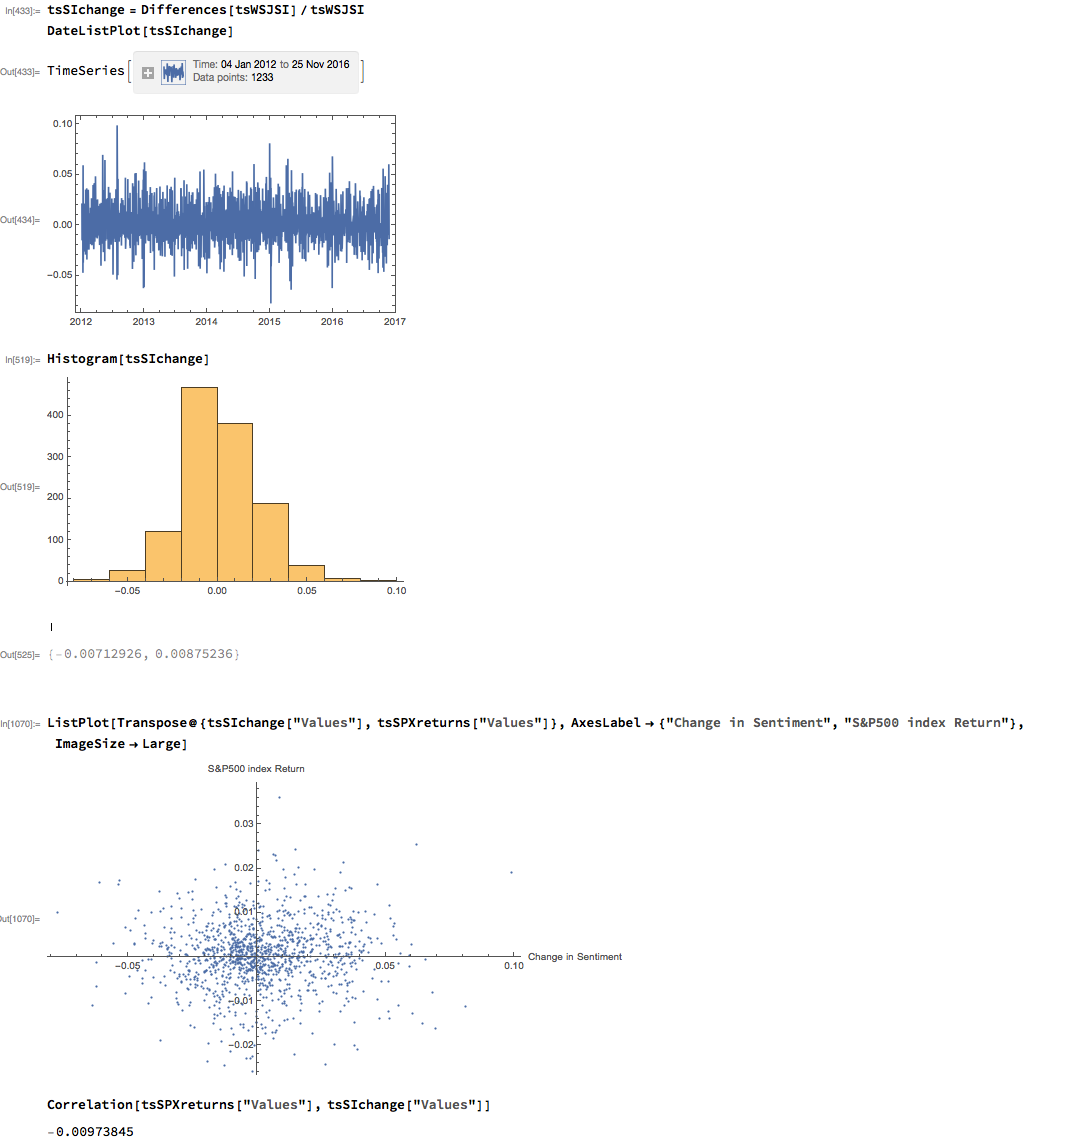
As with most data series in investment research, we are less interested in the level of a variable, such as a stock price, than we are in the changes in level. So the next step is to calculate the daily percentage change in the sentiment indicator and examine the correlation with the corresponding intraday return in the S&P 500 Index. At first glance our sentiment indicator appears to have very little predictive power - the correlation between indicator changes and market returns is negligibly small overall - but we shall later see that this is not the last word.
Conditional Distributions
Thus far the results appear discouraging; but as is often the case with this type of analysis we need to look more closely at the conditional distribution of returns. Specifically, we will examine the conditional distribution of S&P 500 Index returns when changes in the sentiment index are in the upper and lower quantiles of the distribution. This will enable us to isolate the impact of changes in market sentiment at times when the swings in sentiment are strongest. In the analysis below, we begin by examining the upper and lower third of the distribution of changes in sentiment:

The analysis makes clear that the distribution of S&P 500 Index returns is very different on days when the change in market sentiment is large and positive vs. large and negative. The difference is not just limited to the first moment of the conditional distribution, where the difference in the mean return is large and statistically significant, but also in the third moment. The much larger, negative skewness means that there is a greater likelihood of a large decline in the market on days in which there is a sizable drop in market sentiment, than on days in which sentiment significantly improves. In other words, the influence of market sentiment changes is manifest chiefly through the mean and skewness of the conditional distributions of market returns.
A News Trading Algorithm
We can capitalize on these effects using a simple trading strategy in which we increase the capital allocated to a long-SPX position on days when market sentiment improves, while reducing exposure on days when market sentiment falls. We increase the allocation by a factor - designated the leverage factor - on days when the change in the sentiment indicator is in the upper 1/3 of the distribution, while reducing the allocation by 1/leveragefactor on days when the change in the sentiment indicator falls in lower 1/3 of the distribution. The allocation on other days is 100%. The analysis runs as follows:
period = QuantityMagnitude@
   DateDifference[First@datelist, Last@datelist, "Year"];
AnnStd = Sqrt[252]*
   StandardDeviation[
    Transpose@{tsSPXreturns["Values"], strategyreturns}];
cf = {tsVTDSPX[Last@datelist]/1000 - 1,
   tsVTDstrategy[Last@datelist]/1000 - 1};
CAGR = -1 + (1 + cf)^(1/period);
IR = CAGR/AnnStd;

Print[Style["News Sentiment Strategy", "Subsection"]];
P1 = Style[
   NumberForm[
    TableForm[{CAGR, AnnStd, IR},
     TableHeadings -> {{"CAGR", "Ann. StDev.",
        "IR"}, {Style["SP500 Index", Bold],
        Style["Strategy", Bold]}}], {6, 2}], FontSize -> 14];
P2 = DateListPlot[{tsVTDSPX, tsVTDstrategy}, Filling -> Axis,
   PlotLegends -> {"S&P500 Index", "Strategy"},
   PlotLabel -> Style["Value of $1,000", Bold], ImageSize -> Medium];
Print[P1];
Print[P2];
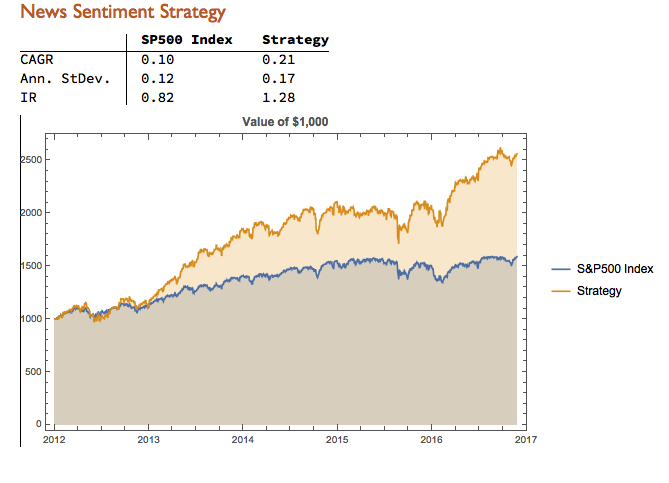
It turns out that, using a leverage factor of 2.0, we can increase the CAGR from 10% to 21% over the period from 2012-2016 using the conditional distribution approach. This performance enhancement comes at a cost, since the annual volatility of the news sentiment strategy is 17% compared to only 12% for the long-only strategy. However, the overall net result is positive, since the risk-adjusted rate of return increases from 0.82 to 1.28.
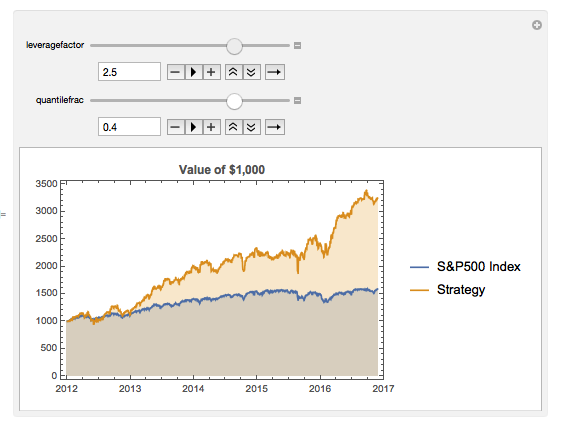
We can explore the robustness of the result, comparing different quantile selections and leverage factors using Mathematica's interactive Manipulate function:
Manipulate[
 percentiles =
  Quantile[tsSIchange, {quantilefrac, 1 - quantilefrac}];
 bottompercentile =
  Flatten[Position[tsSIchange["Values"],
    x_ /; x < percentiles[[1]]]];
 toppercentile =
  Flatten[Position[tsSIchange["Values"],
    x_ /; x > percentiles[[2]]]];
 strategyreturns = tsSPXreturns["Values"];
 strategyreturns[[bottompercentile]] = (1/leveragefactor)*
   strategyreturns[[bottompercentile]];
 strategyreturns[[toppercentile]] =
  leveragefactor*strategyreturns[[toppercentile]];
 tsVTDstrategy =
  TimeSeries[
   Transpose[{datelist,
     1000*FoldList[Times, 1, 1 + strategyreturns]}]];
 DateListPlot[{tsVTDSPX, tsVTDstrategy}, Filling -> Axis,
  PlotLegends -> {"S&P500 Index", "Strategy"},
  PlotLabel -> Style["Value of $1,000", Bold],
  ImageSize -> Medium], {leveragefactor, 1, 3}, {quantilefrac, 0.1,
  0.5}]
Conclusion
A simple market sentiment indicator can be created quite easily from publicly available news archives, using a standard machine learning sentiment classification algorithm. A market sentiment algorithm constructed using methods as straightforward as this appears to provide the capability to differentiate the conditional distribution of market returns on days when changes in market sentiment are significantly positive or negative. The differences in the higher moments of the conditional distribution appears to be as significant as the differences in the mean. In principle, we can use the insight provided by the sentiment indicator to enhance a long-only day-trading strategy, increasing leverage and allocation on days when changes to market sentiment are positive and reducing them on days when sentiment declines. The performance enhancements resulting from this approach appear to be significant.
Several caveats apply. The S&P 500 index is not tradable, of course, and it is not uncommon to find trading strategies that produce interesting theoretical results. In practice one would be obliged to implement the strategy using a tradable market proxy, such as a broad market ETF or futures contract. The strategy described here, which enters and exits positions daily, would incur substantial trading costs, that would be further exacerbated by the use of leverage.
Of course there are many other uses one can make of news data, in particular with firm-specific news and sentiment analytics, that fall outside the scope of this article. Hopefully, however, the methodology described here will provide a sign-post towards further, more practically useful research.