Message Boards Message Boards

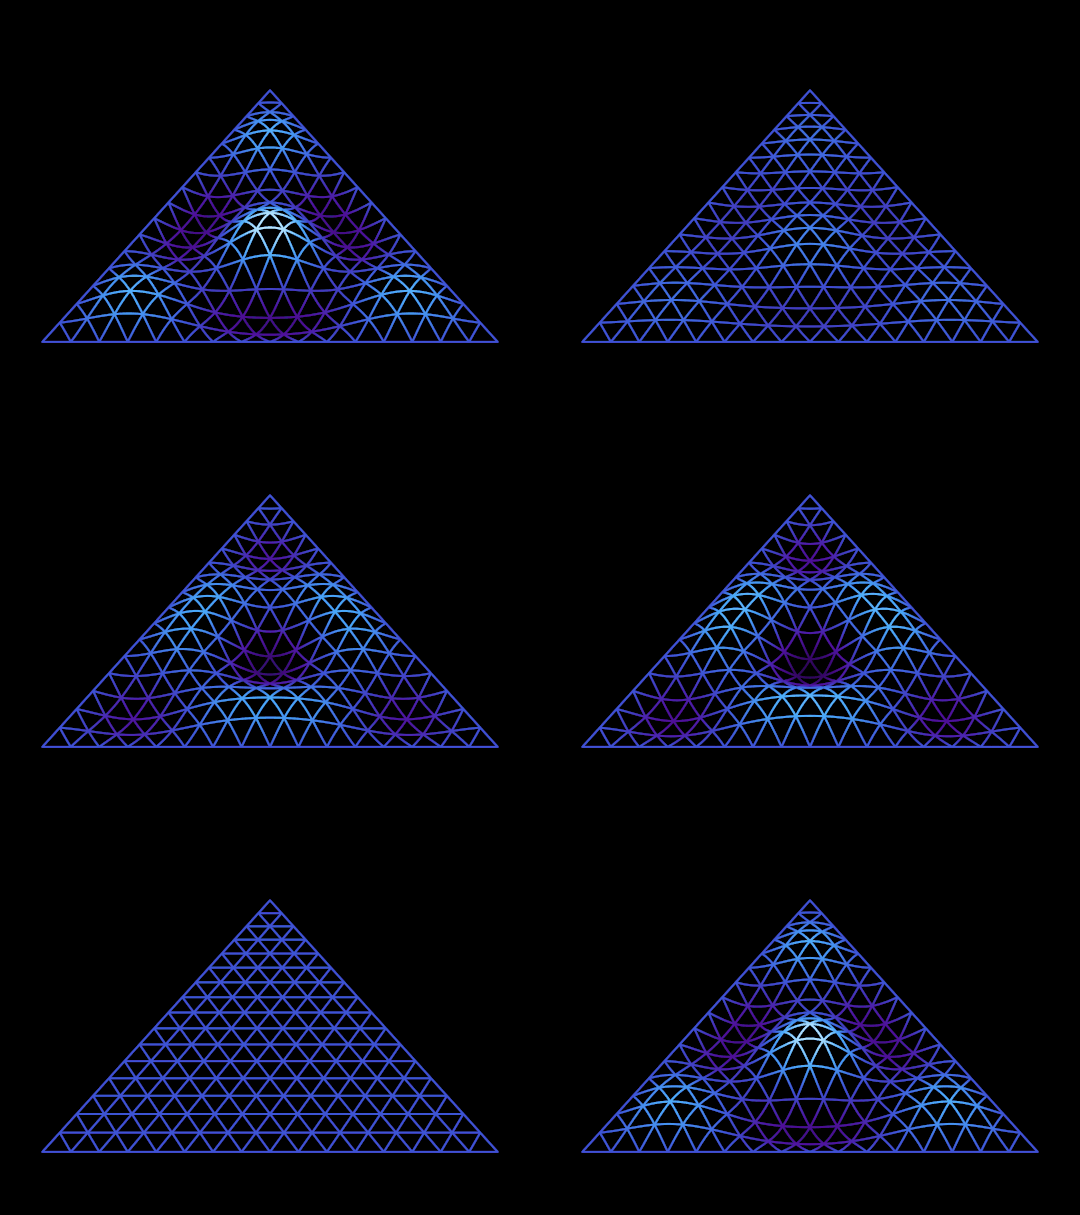
[GIF] Things That Go Bump in the Night (Vibrational mode of the triangle)

Vibrational mode of the equilateral triangle

Things That Go Bump in the Night

This is the $(1,2)$ vibrational mode of an equilateral triangle, in the same spirit as Drumbeat, which showed the $(1,2)$ mode on the disk, and The Band Plays On and Good Vibrations, which showed the nodal lines of a family of vibrational modes on the square and on the disk, respectively.

I found an analytic expression for the vibrational modes of the equilateral triangle in B.R. Seth's paper "Transverse vibrations of triangular membranes" (available here for free); he in turn credits Lamé's Leçons sur la Théorie Mathématique de L'Elasticité des Corps Solides from 1866, which is encoded in the following function (as noted in Seth's paper, the $(0,n)$ modes have a somewhat nicer expression in trilinear coordinates, so I wouldn't be surprised if the general $(m,n)$ mode does as well):

EquilateralVibration[m_, n_, {x_, y_}, t_] := Module[
   {a = Sqrt[3]/2},
   (2 Sin[(m - n) \[Pi] x/a] Cos[2 (m + n) \[Pi] y] - 
      2 Sin[(2 m + n) \[Pi] x/a] Cos[2 n \[Pi] y] + 
      2 Sin[(2 n + m) \[Pi] x/a] Cos[2 m \[Pi] y]) Cos[t]
   ];

From there, it was just a matter of finding a nice presentation; as in, for example, Catecoid, I ended up wanting a mesh without the surface and ended up using an idea from this thread (this time, @J. M.'s answer) to get variable-color mesh lines.

Here's the rest of the code:

EqMaxVal = With[
   {m = 1, n = 2, x = Sqrt[3]/6, y = 1/2, t = 0.},
   EquilateralVibration[m, n, {-(x/2) + (Sqrt[3] y)/2, (Sqrt[3] x)/2 + y/2}, t]
   ];

With[{m = 1, n = 2},
 Manipulate[
  Show[
   ParametricPlot3D[
      Evaluate@Table[
        {#[[1]], #[[2]], EquilateralVibration[m, n, {#[[1]], #[[2]]}, t]},
        {x, 0, Sqrt[3]/2, Sqrt[3]/32}],
      {y, 0, 1},
      RegionFunction -> Function[{x, y, z}, x - Sqrt[3] y <= 0 && x/Sqrt[3] + y <= 1],
      PlotRange -> {{0, Sqrt[3]/2}, {0, 1}, {-6, 6}}, Boxed -> False, 
      Axes -> None, PlotStyle -> Thickness[.005], 
      ColorFunction -> Function[{x, y, z}, ColorData["DeepSeaColors"][(z + EqMaxVal)/(2 EqMaxVal)]],
      ColorFunctionScaling -> False]
     & /@ {{x, y}, {-(x/2) + (Sqrt[3] y)/2, (Sqrt[3] x)/2 + y/2}, 
       {-(Sqrt[3]/4) + x/2 + (Sqrt[3] y)/2, 1/4 + (Sqrt[3] x)/2 - y/2}},
   BoxRatios -> {Sqrt[3]/2, 1, 1/EqMaxVal}, ViewPoint -> {-2, 0, 2}, 
   ImageSize -> {540, 405}, ViewAngle ->  \[Pi]/9, Background -> Black],
  {t, 0, 2 \[Pi]}]
 ]
8 Replies
Posted 3 years ago

Apparently this code has some bug and won't run in 12.2 version.

POSTED BY: chitres guria

Try now.

Posted 3 years ago

Works. Many thanks.

POSTED BY: chitres guria

My interest in mathematical art is at an all time low, but this thread is not bad, especially with recent addition of video data for oscillating latex.

I checked some references, and now believe my initial positing is partly rushed / confused / wrong. For a first pass, we can just start with the frequency result for a linear string of mass $m$ and length $L$

$f \propto \sqrt{\frac{T}{m L}} = \sqrt{\frac{k}{m}} . $

From this equation we can see that $f$ is only constant if tension force obeys a simple Hooke Law

$T = k L .$

For small changes in $L$ a linear approximation will usually apply, but larger changes in $L$ could explore the curvature of the Stress vs. Strain curve, which does depend on the material. In the above, when I say "anharmonic deformation", I mean that tension $T$ expands in a power series of length $L$:

$T = k_1 L + k_2 L^2 + k_3 L^3 + . . . $

The coefficient $k_2$ does not have to be large to cause some effect. For example, In Large Amplitude Motion of a String Fig. 1 purports to depict linear data, but it looks to me like it could have non-negligable quadratic components in a series expansion in powers of $L$. As the article says, whenever $k_i \neq 0$ for $i > 1$, it is not possible to derive the wave equation.

Anharmonic motion could be solved by dividing the string into many equal masses and iterating Newton's equations using numerical methods, with the additional requirement that the force function between masses is not a simple Hooke's law as is usually assumed. The same approach generalizes to two or three dimensions.

Where I've seen a great many harmonic calculations, I rarely ever see calculations including anharmonicity, so again, could be an interesting / worthwhile direction.

On the subject of anharmonic wave equations, it's also interesting to take note of anharmonicity and quantum vibrations. Harmonic oscillation is often a low-amplitude expectation for vibrational motion, especially in the adiatbatic approximation ( Born Oppenheimer ). But force or potential expansions in nature usually contain higher order terms, easier to notice and measure with laser technology.

One commonly found example in laboratory quantum mechanics is molecular Iodine. Peaks in the vibrational frequency spectrum ( the eigenvalues ) are expected to have uniform first differences if harmonic, but even linear spacing is easy enough to find in laboratory data. This is the basis for the famous Birge-Sponer method.

POSTED BY: Brad Klee

Hi Clayton,

One criticism to these drum posts you are making: In most, probably all, of my drum observations, I've seen oscillations with considerably smaller amplitude.

Exagerating the amplitude makes the pictures look more fantastic, but then you have to choose between mathematical art and physics.

The problem is that exaggeration of amplitude could also make the wave equation a poor model. This is the case in physics as soon as you start to assume that the tension / surface tension is not constant. It is also possible to invalidate the wave equation by introducing anharmonic deformation.

I think you are safe using the following heuristics for applying the wave equation to nature:

  • 1D strings: string length changes negligibly during oscillation.
  • 2D drums: surface area changes negligibly during oscillation.

Under these heuristics, tension / surface tension should be approximately constant.

Actually it's an interesting possibility, which I have yet to calculate in detail: how much would the frequency of a vibrating string change in large amplitude motion, and would that frequency delta be observable in a lab experiment?

POSTED BY: Brad Klee

I think Clayton mostly goes for the art of it and I love his works exactly for that ;-) Also amplitude would depend on material. I remember rubber membranes and strings could make some highly visible standing waves. Here is a more or less visible example: Circular Membrane (drum head) Vibration.

POSTED BY: Sam Carrettie

Exagerating the amplitude makes the pictures look more fantastic, but then you have to choose between mathematical art and physics.

As @Sam Carrettie suggests, I'm absolutely choosing mathematical art over physics in these posts (though note that in the video he links to, the $(1,2)$ mode on the circular membrane has an amplitude that isn't so far off what's in Drumbeat).

That being said, if you have a good reference for how to model large-amplitude vibrations, I'd certainly be happy to look into it.

enter image description here - Congratulations! This post is now Staff Pick! Thank you for your wonderful contributions. Please, keep them coming!

POSTED BY: EDITORIAL BOARD
Reply to this discussion
Community posts can be styled and formatted using the Markdown syntax.
Reply Preview
Attachments
Remove
or Discard

Group Abstract Group Abstract