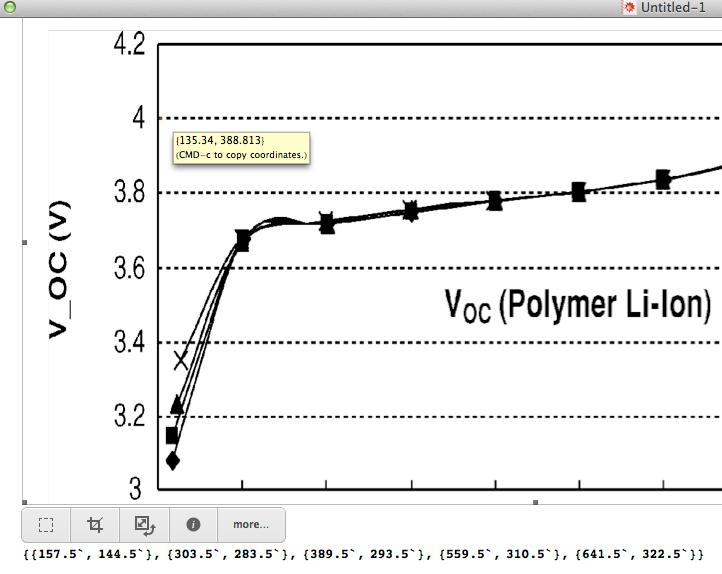
If you cannot write the author and ask for the data values, you can get the point coordinates with Mathematica.
Copy the plot into a Mathematica notebook and right-click on it (Control-click on one-button-mouse Macintoshes).
In the popup menu, choose Get Coordinates. Place the mouse cursor over each point and press Control-C /
Command-C to save the coordinates. After you have copied all the coordinates, click the mouse cursor away
from the plot and paste the coordinates into the notebook. The coordinates can be used in Interpolation or
FindFit. (Good idea: also get the coordinates of markers on the left edge of the plot to set the y-axis scaling and
to check for how slanted the plot might be.)

My screen capture did not get the mouse cursor, which was pointing at the left edge of the plot, the 4.0 tick mark.
In the case above, the coordinates are definitely not in the scale of the plot. Since you know that the points are
0.1 apart in the X direction and you got the Y coordinates for 3 and 4, a little scaling function can be written to
convert the points to the plot space.