Message Boards Message Boards

1
|
2207 Views
|
3 Replies
|
1 Total Likes
View groups...
Share
Share this post:

Separating Multiple Plots and Applying Curve-fit to each of them ?

Hello all,

I have an image for Open Circuit Voltage (V_OC) vs. State of Charge (SOC) of a battery. V_OC and SOC are represented in the y-axis and the x-axis respectively. The image is a combination of 4 plots obtained experimentally. The four separate plots are each represented by the 4 data-markers that denote the data points on each plot. How can I separate the 4 plots, if at all, and then obtain the curve fit for the plots individually ? The x-axis begins at 0 and every tick represents an increment of 0.1, all the way upto 1.  

Thank you. 

POSTED BY: Shailesh Divey
3 Replies
If you cannot write the author and ask for the data values, you can get the point coordinates with Mathematica.

Copy the plot into a Mathematica notebook and right-click on it (Control-click on one-button-mouse Macintoshes).
In the popup menu, choose Get Coordinates.  Place the mouse cursor over each point and press Control-C /
Command-C to save the coordinates. After you have copied all the coordinates, click the mouse cursor away
from the plot and paste the coordinates into the notebook.  The coordinates can be used in Interpolation or
FindFit.  (Good idea: also get the coordinates of markers on the left edge of the plot to set the y-axis scaling and
to check for how slanted the plot might be.)


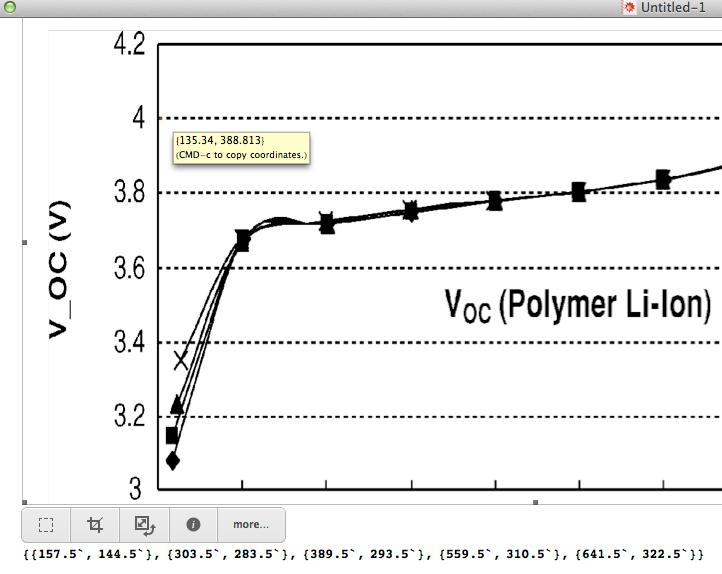
My screen capture did not get the mouse cursor, which was pointing at the left edge of the plot, the 4.0 tick mark.

In the case above, the coordinates are definitely not in the scale of the plot. Since you know that the points are
0.1 apart in the X direction and you got the Y coordinates for 3 and 4, a little scaling function can be written to
convert the points to the plot space.
POSTED BY: Bruce Miller
Thank you Bruce. I was able to come up with a solution implementing what you suggested,although the numbers are not entirely to my liking, It is a start nonetheless. I need to come up with a better scaling function though I think in order to get an improved fit. 
POSTED BY: Shailesh Divey
This question is very similar (though slightly more complicated) to a question I answered here:

http://community.wolfram.com/groups/-/m/t/45430
POSTED BY: Arnoud Buzing
Reply to this discussion
Community posts can be styled and formatted using the Markdown syntax.
Reply Preview
Attachments
Remove
or Discard

Group Abstract Group Abstract