For the past couple of years I've been playing collecting and analyzing data collected from used car auctions in my free time with an automotive journalist to try and get an idea of what the used car market looks like in terms of long-term vehicle reliability, and I figured it was about time that I showed off some of the ways that the Wolfram Language has allowed us to parse through information on over 1 million vehicles ( and counting! ).
I'll start off by saying that there isn't anything terribly elaborate about the process we're using to collect and analyze the information on these vehicles; it's mostly a process of reading in reports from our data provider(and cleaning up the data), and then cross-referencing that data with various automotive APIs to get additional information and dumping them into a database that we then use for our analysis, but having all of the tools we need build into the Wolfram Language makes the entire operation something that can be scripted, which greatly stream-lines the process. I'll have to skip over some of the details or this will be a /very/ long post, but I'll try to cover most of the key elements.
The data we get comes in from a 3rd party provider that manages used car auctions around the country(unfortunately our licensing agreement doesn't allow me to share the data right now, but I can talk about how things work), and unfortunately it's not very computable at first(the data comes in as a text file report once a week):
text = "01/02/2017 Schaumburg 128 1999 Acura CL 3.0 2D Coupe 131612 \
19UYA2256XL014922 Green A,L,R,Y
      9:00 AM Illinois Announcements: Major Transmission Defect, \
Miles Exempt
      01/02/2017 Hickory 33 1997 Acura CL 2.2 2D Coupe 217449 \
19UYA1255VL011890 Blue A,L,R,Y
      2:00 PM North Carolina Announcements: Major Transmission Defect
      01/02/2017 Ft. Bend 46 1995 Acura Integra LS 4D Sedan 98124 \
JH4DB7654SS013119 Green A,R
      9:30 AM Texas Announcements: Miles Exempt
      01/03/2017 Kansas City 57 1992 Acura Integra LS 4D Sedan 174537 \
JH4DB1653NS000122 T/A Yellow A,Y
      2:00 PM Kansas Announcements: Structural Damage, Title Absent
  ";
Fortunately parsing this sort of log-like data into individual records is easy in WL using basic string patterns:
In[31]:= vinPattern = RegularExpression["[A-Z\\d]{17}"];

In[32]:= recordPattern =
  DatePattern[{"Month", "Day", "Year"}] ~~ __ ~~ vinPattern ~~ __ ~~
   "Announcements:" ~~ __ ~~ "\n";

In[38]:= StringCases[text, Shortest[recordPattern]]

Out[38]= {"01/02/2017 Schaumburg 128 1999 Acura CL 3.0 2D Coupe \
131612 19UYA2256XL014922 Green A,L,R,Y
     9:00 AM Illinois Announcements: Major Transmission Defect, Miles \
Exempt
 ", "01/02/2017 Hickory 33 1997 Acura CL 2.2 2D Coupe 217449 \
19UYA1255VL011890 Blue A,L,R,Y
     2:00 PM North Carolina Announcements: Major Transmission Defect
 ", "01/02/2017 Ft. Bend 46 1995 Acura Integra LS 4D Sedan 98124 \
JH4DB7654SS013119 Green A,R
     9:30 AM Texas Announcements: Miles Exempt
 ", "01/03/2017 Kansas City 57 1992 Acura Integra LS 4D Sedan 174537 \
JH4DB1653NS000122 T/A Yellow A,Y
     2:00 PM Kansas Announcements: Structural Damage, Title Absent
 "}
and then it's mostly a matter of cleaning up the individual records into something more standardized(I'll spare you some of the hacky details due to artifacts in the data feed) and end up with something like:
record = <|"Date" -> "2017-01-02", "ModelYear" -> 1999,
  "Make" -> "Acura", "Model" -> "CL", "TransmissionIssue" -> True,
  "EngineIssue" -> False, "Miles" -> 131612,
  "VIN" -> "19UYA2256XL014922"|>
From there we use the handy Edmunds vehicle API to get more information on the vehicle using their VIN decoder and get lots of details on the specific vehicle:
In[50]:= DeleteCases[lookupVIN["19UYA2256XL014922"],
 HoldPattern[
  "attributeGroups" | "options" | "standardEquipment" -> _], -1]

Out[50]= {"styleHolder" -> {{"engineCompressorType" -> Null,
    "trim" -> {"name" -> "3.0", "niceName" -> "30"},
    "makeNiceName" -> "acura", "niceName" -> "302drcoupe",
    "modelId" -> "Acura_CL", "typicallyEquippedSpecifications" -> {},
    "transmissionType" -> "AUTOMATIC", "id" -> 12843,
    "makeId" -> 200002038, "engineCylinder" -> 6, "engineSize" -> 3.,
    "year" -> 1999, "specification" -> Null, "modelName" -> "CL",
    "publicationState" -> "USED", "engineType" -> "gas",
    "modelNiceName" -> "cl", "modelLinkCode" -> "M030001",
    "makeName" -> "Acura", "engineFuelType" -> "regular unleaded",
    "modelYear" -> {"link" -> "/api/vehicle/acura/cl/1999"},
    "modelYearId" -> 960,
    "price" -> {"baseInvoice" -> Null, "baseMSRP" -> Null,
      "deliveryCharges" -> Null, "tmv" -> Null,
      "usedTmvRetail" -> 2799., "usedPrivateParty" -> 1688.,
      "estimateTmv" -> False, "usedTradeIn" -> 1022.,
      "tmvRecommendedRating" -> Null}, "optionalEquipment" -> {},
    "categories" -> {"Vehicle Size" -> {"Midsize"},
      "PRIMARY_BODY_TYPE" -> {"Car"}, "Vehicle Style" -> {"Coupe"},
      "Vehicle Type" -> {"Car"},
      "Market" -> {"Luxury", "Performance"}},
    "usedEquipment" -> {{"link" ->
        "/api/vehicle/equipment/tmvu128434410000001"}},
    "configurableEquipment" -> {}, "regionRestrictions" -> {},
    "squishVins" -> {{"engineNames" -> {"6VNAG3.0"},
       "squishVin" -> "19UYA225XL",
       "squishVinTransmissions" -> {{"transmissionType" -> "AT",
          "numberOfSpeeds" -> 4}}}},
    "subModels" -> {{"id" -> 200670396, "styleIds" -> {12841, 12843},
       "identifier" -> "Coupe", "name" -> "CL Coupe",
       "submodelNewDefaultStyle" -> {"link" ->
          "/api/vehicle/style/12843"},
       "publicationStates" -> {"USED"}, "ruleType" -> "body",
       "submodelUsedDefaultStyle" -> {"link" ->
          "/api/vehicle/style/12841"}}}, "name" -> "3.0 2dr Coupe",
    "makeShare" -> Null}}}
(I used the DeleteCases here to cut down on the size of the output; a lot more data comes back in those specific attribute groups)
We then insert the records into an HSQL database(conveniently included with Mathematica) and have an easy way to search for the records we want:
In[56]:= SQLSelect[$DataBase,$Table,{"Year","Miles","Transmission"},And[SQLColumn["Make"]=="Nissan",SQLColumn["Model"]=="Cube",SQLColumn["Year"]<=2010]]//Short
Out[56]//Short= {{2010,27310,0},{2010,54447,0},{2009,89206,0},<<218>>,{2009,112717,0},{2009,86715,0},{2009,96257,0}}
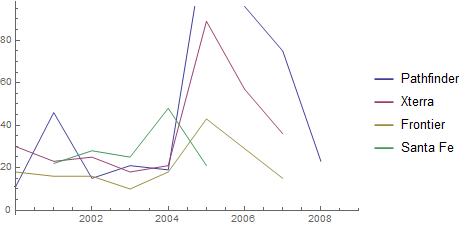
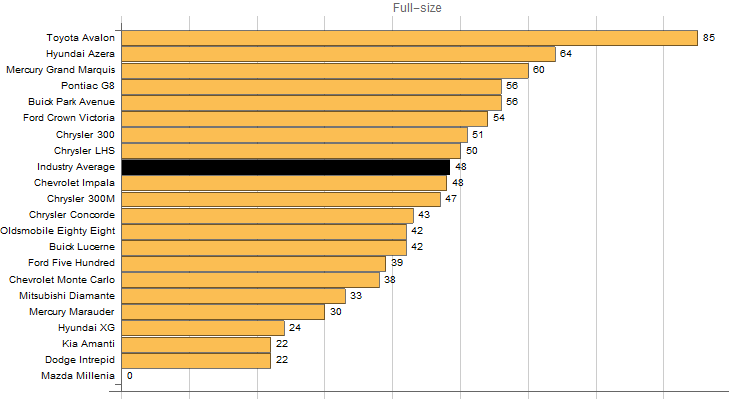
From there we can take a quick look at metrics using larger data sets, such as the number of transmission issue for a given set of vehicles for different model years:
or a histogram of those issues broken down by vehicle mileage: 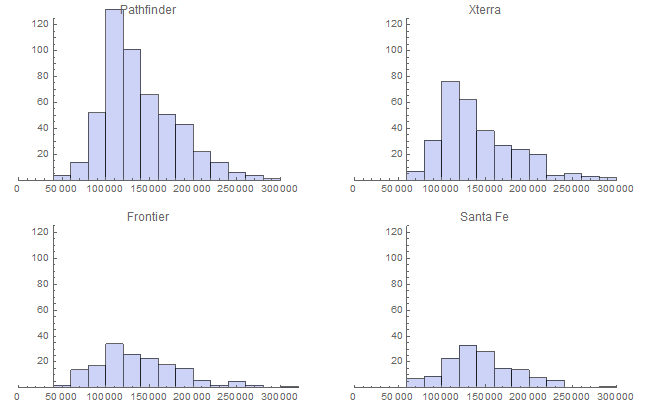
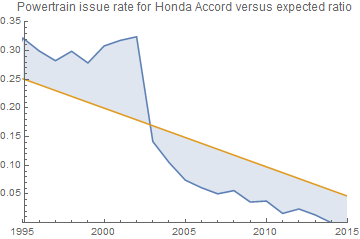
It also lets us look at industry-wide trends, so we can develop a base-line for what the expected rate of defects for an average vehicles(or vehicle of a certain class) should be:
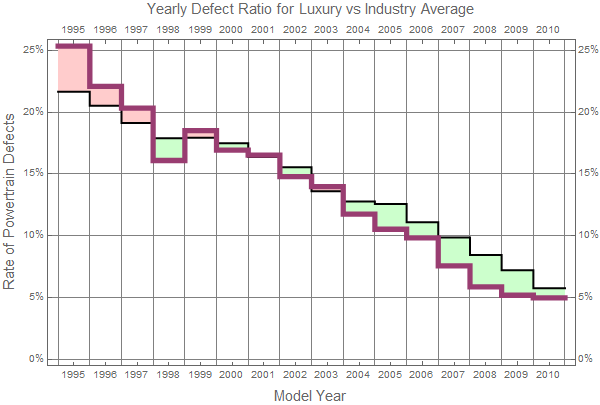
lm=LinearModelFit[modeldata,{date,modelyear},{date,modelyear}]

FittedModel[18.2513 +6.61972*10^-10 date-0.0102383 modelyear]
and can compare a given vehicle to that model:
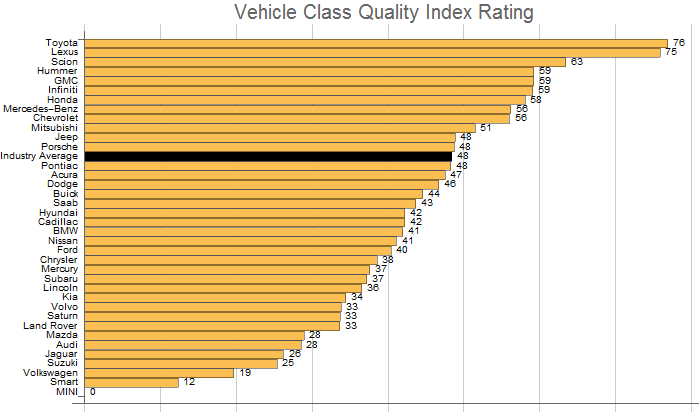
We then use that model, as well as other information, to generate a statistical index which we use to give vehicles an overall quality rating, based on their historical reliability, which ranges from a score of 0(chronic reliability issues) to 100 (exceptional reliability), with the industry average hovering right around 50:
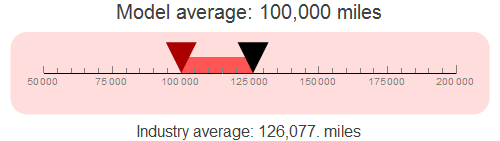
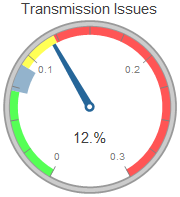
We also use various gauges to put together informative visualizations of defect rates and the overall quality:
MileageGauge[mileage_, opts___] := With[{color = Which[
          mileage <= 100000, Lighter[Red],
          100000 <= mileage <= 120000, Lighter[Yellow],
          120000 <= mileage <= 130000, Lighter[Blue],
          True, Lighter[Green]]},
    HorizontalGauge[{mileage, $IndustryAverageMileage}, {50000,
    200000},
       ScalePadding -> {.08, .1},
      GaugeLabels -> {
            Placed[
      Style[Row[{"Model average: ",
         AccountingForm[mileage, DigitBlock -> 3], " miles"}],
       FontSize -> 20], Above],
            Placed[
      Style[Row[{"Industry average: ",
         AccountingForm[$IndustryAverageMileage, DigitBlock -> 3],
         " miles"}], FontSize -> 16], Below]
            },
      ScaleRanges -> {If[
      mileage < $IndustryAverageMileage, {mileage, \
$IndustryAverageMileage}, {$IndustryAverageMileage, mileage}]},
      ScaleRangeStyle -> color, GaugeStyle -> {Darker[Red], Black},
      ImageSize -> 500,
      ScaleDivisions -> {7, 7}, GaugeFaceStyle -> Lighter[color, .8],
      opts]
    ]
announcementGauge[value_] :=
  AngularGauge[value, {0, .3},
    GaugeLabels -> Style[ToString[N[value, 3]*100] <> "%", 15],
    PlotLabel -> Style["Transmission Issues", 15],
    ScaleRanges -> {{0, $IndustryAverageIssueRates[[2]] - .01} ->
          Lighter[Green], {{$IndustryAverageIssueRates[[2]] - .01,
            $IndustryAverageIssueRates[[2]] + .01}, {0, .2}}, \
{$IndustryAverageIssueRates[[2]] + .01,
      1.5*$IndustryAverageIssueRates[[2]]} ->
          Lighter[Yellow], {1.5*$IndustryAverageIssueRates[[2]], 1} ->
     Lighter[Red]},
    GaugeStyle -> {RGBColor[{.15, .4, .6}], RGBColor[{.5, .5, .5}]}]
There is a lot more we do to pull all of this together(like the WL templating we use to generate the HTML pages and reports), and honestly there is a whole lot more we could do(my background in statistics is pretty limited, so most of this is pretty rudimentary, and I'm sure others here may already have ideas for different improvements in presentation for some of this data). If you'd like to take a look at the site it's freely available(Steve has a nice introduction to the site here, and he also writes articles for the page related to practical uses for our findings).
Our original site was called the Long-term Quality Index which is still live, but showed off my lack of experience in HTML development, so we recently rolled out our newer, WordPress based venture Dashboard-Light which also includes insights from our auto journalist on his experiences running an independent used car dealership.
This is essentially a two-man project that Steve and I handle in our(limited) free time, and we're still getting a handle on presenting the data in a useful way, so if anyone has any suggestions, or questions about our methodology, feel free to reach out to us.
Cheers!


