
 User Portlet
| Discussions |
|---|
| Thanks to let me know and your excellent support ! Best Regards,....Jos |
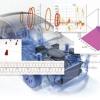
| Hey Alexander, Is this what you looking for? ......Regards, Jos ![enter image description here][1] [1]: http://community.wolfram.com//c/portal/getImageAttachment?filename=Ticks.gif&userId=185016 parameters = {{1, 0.910299}, {2,... |
| Dear S M Blinder, Thanks, I am working on a similar code, but can I add also a Manipulator to start filling from the lowest peak up to the highest peak? Your support will be highly appreciated ! Regards,....Jos |
| Dear Mr. Seth Chandler, Thanks for your information, this is very useful ! Regards,.....Jos |
| Plot[t^3 && -25 Text[y == x^3, {3.2, 15}] ] |
| Hi Sander, Thanks for your quick replay and excellent support ! Best Regards,.....Jos |
| Hi Margherita, I hope this will help. Cheers,....Jos (MM Version 10.4.0.0) a = {10, 11, 15, 14}; b = {2, 5, 4, 6}; ListLinePlot[{a, b} , Frame -> True , PlotLabel -> Style["Test"] , PlotRange -> {{1, 4},... |
| ![enter image description here][1] [1]: http://community.wolfram.com//c/portal/getImageAttachment?filename=LabelStyle.gif&userId=185016 |
| Hi John, Thanks for your excellent support ! Regards,.......Jos |
| Hi Henrik, I'm very pleased with your support and tips. This is what I'm looking for. Thank You. Regards,......Jos |