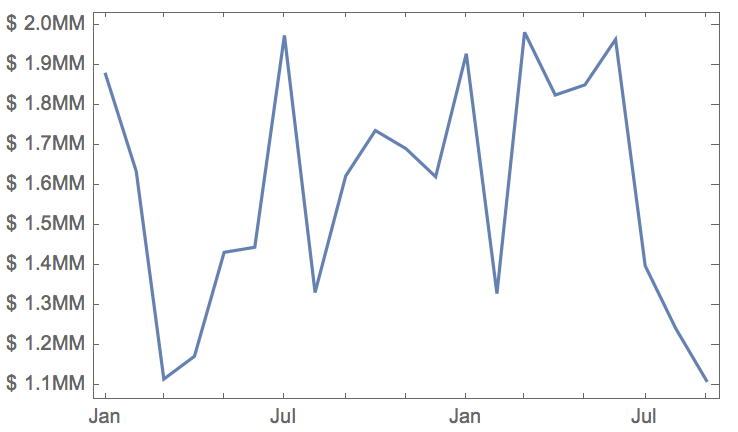
Manually specify the ticks:
mydata=EventSeries@Table[{DatePlus[DateObject[{2010,1,1}],{x,"Month"}],10^6 RandomReal[{1,2}]},{x,0,20}];
rightticks=leftticks = {# 10^6,"$ "<>ToString[NumberForm[#,{\[Infinity],1}]]<>"MM"}&/@Range[1,2,0.1];
rightticks[[All,2]]="";
myplot=DateListPlot[mydata,FrameTicks->{{leftticks,rightticks},{Automatic,Automatic}}]

Using FindDivisions you could automate the position of the ticks. Which is also what internally is used by the various plot functionalities...