Message Boards Message Boards

1
|
13396 Views
|
7 Replies
|
3 Total Likes
View groups...
Share
Share this post:

Perform simple reformatting of the ticks in a plot?

Posted 8 years ago

I often deal with graphs involving large dollar amounts over time. Mathematica will generally format Y-axis ticks as scientific numbers {1.0x10^6, 1.2x10^6 . . . etc.}.

So for example,

mydata = EventSeries@
  Table[{DatePlus[DateObject[{2010, 1, 1}], {x, "Month"}], 
    10^6 RandomReal[{1, 2}]}, {x, 0, 20}];

myplot = DateListPlot[mydata] (* produces a Y-axis in scientific notation, which is not what I want *)

I'm happy to let Mathematica pick where the ticks go, but I want to change the formatting to {$1.0MM, $1.2MM . . . etc.}.

Is there an elegant way to do this?

POSTED BY: Michael Stern
7 Replies
Posted 8 years ago
POSTED BY: Michael Stern

You can intercept the automatically generated ticks and then tweak them, for example with a replacement rule. Something like this:

myPlot = Plot[Sin[x], {x, 0, Pi}]
tks = Ticks /. AbsoluteOptions[myPlot, Ticks];
Show[myPlot, 
 Ticks -> {tks[[1]] /. {x_Real, tk_Real, rest___} :> {x, 
      Rationalize[tk/Pi, Pi/10000] Pi, rest}, tks[[2]]}]
POSTED BY: Gianluca Gorni

Manually specify the ticks:

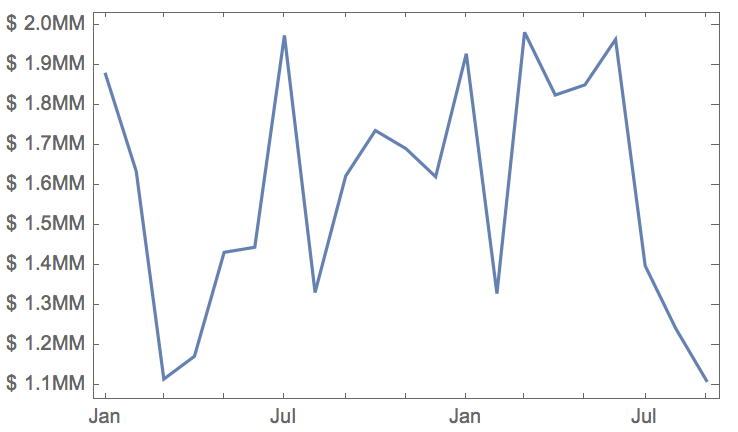
mydata=EventSeries@Table[{DatePlus[DateObject[{2010,1,1}],{x,"Month"}],10^6 RandomReal[{1,2}]},{x,0,20}];
rightticks=leftticks = {# 10^6,"$ "<>ToString[NumberForm[#,{\[Infinity],1}]]<>"MM"}&/@Range[1,2,0.1];
rightticks[[All,2]]="";
myplot=DateListPlot[mydata,FrameTicks->{{leftticks,rightticks},{Automatic,Automatic}}]

enter image description here

Using FindDivisions you could automate the position of the ticks. Which is also what internally is used by the various plot functionalities...

POSTED BY: Sander Huisman

Currently only semi-manually, like Gianluca proposed...

POSTED BY: Sander Huisman
Posted 8 years ago

This doesn't work with DateListPlots.

POSTED BY: Michael Stern

Hmm, AbsoluteOptions gives useless result with DateListPlot. A workaround is to get the ticks from a ListPlot and to feed them to DateListPlot:

data = {{{2017, 1, 1}, 1}, {{2017, 2, 1}, 2}};
nonDatePlot = ListPlot[data[[All, -1]]];
tks = Ticks /. AbsoluteOptions[nonDatePlot];
modifiedTks = 
  tks[[2]] /. {x_Real, tk_Real, rest___} :> {x, 
     Rationalize[tk/Pi, Pi/10000] Pi, rest};
DateListPlot[data, 
 FrameTicks -> {{modifiedTks, Automatic}, Automatic}]
POSTED BY: Gianluca Gorni
Posted 4 years ago

Hi, I am interested in this solution too. I would like to use human readable numeric values on my charts, not in scientific notation. I could not find how to do that. I am using Mathematica 12.1.1 Thanks!

POSTED BY: Alan Parson
Reply to this discussion
Community posts can be styled and formatted using the Markdown syntax.
Reply Preview
Attachments
Remove
or Discard

Group Abstract Group Abstract