Message Boards Message Boards

1
|
13974 Views
|
7 Replies
|
3 Total Likes
View groups...
Share
Share this post:

Perform simple reformatting of the ticks in a plot?

Posted 8 years ago

I often deal with graphs involving large dollar amounts over time. Mathematica will generally format Y-axis ticks as scientific numbers {1.0x10^6, 1.2x10^6 . . . etc.}.

So for example,

mydata = EventSeries@
  Table[{DatePlus[DateObject[{2010, 1, 1}], {x, "Month"}], 
    10^6 RandomReal[{1, 2}]}, {x, 0, 20}];

myplot = DateListPlot[mydata] (* produces a Y-axis in scientific notation, which is not what I want *)

I'm happy to let Mathematica pick where the ticks go, but I want to change the formatting to {$1.0MM, $1.2MM . . . etc.}.

Is there an elegant way to do this?

POSTED BY: Michael Stern
7 Replies

Manually specify the ticks:

mydata=EventSeries@Table[{DatePlus[DateObject[{2010,1,1}],{x,"Month"}],10^6 RandomReal[{1,2}]},{x,0,20}];
rightticks=leftticks = {# 10^6,"$ "<>ToString[NumberForm[#,{\[Infinity],1}]]<>"MM"}&/@Range[1,2,0.1];
rightticks[[All,2]]="";
myplot=DateListPlot[mydata,FrameTicks->{{leftticks,rightticks},{Automatic,Automatic}}]
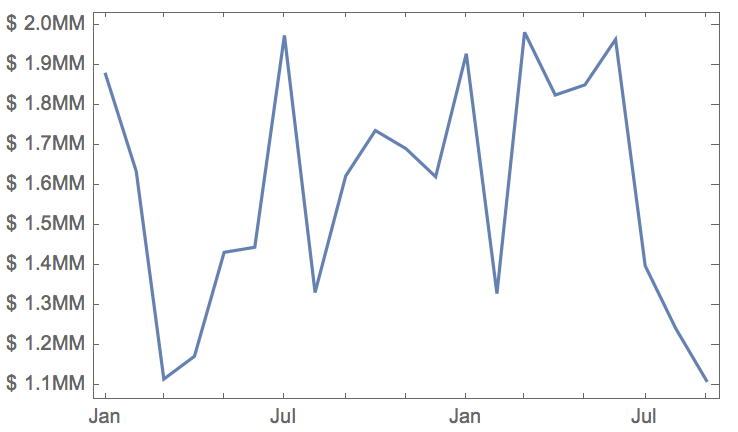
enter image description here

Using FindDivisions you could automate the position of the ticks. Which is also what internally is used by the various plot functionalities...

POSTED BY: Sander Huisman
Posted 8 years ago

I generate a lot of these graphs with varying Y-axes so I would greatly prefer not to have to set the upper and lower bounds by hand. Is there some mechanism that lets Mathematica pick the placement but lets me pick the formatting?

POSTED BY: Michael Stern

You can intercept the automatically generated ticks and then tweak them, for example with a replacement rule. Something like this:

myPlot = Plot[Sin[x], {x, 0, Pi}]
tks = Ticks /. AbsoluteOptions[myPlot, Ticks];
Show[myPlot, 
 Ticks -> {tks[[1]] /. {x_Real, tk_Real, rest___} :> {x, 
      Rationalize[tk/Pi, Pi/10000] Pi, rest}, tks[[2]]}]
POSTED BY: Gianluca Gorni

Currently only semi-manually, like Gianluca proposed...

POSTED BY: Sander Huisman
Posted 8 years ago

This doesn't work with DateListPlots.

POSTED BY: Michael Stern

Hmm, AbsoluteOptions gives useless result with DateListPlot. A workaround is to get the ticks from a ListPlot and to feed them to DateListPlot:

data = {{{2017, 1, 1}, 1}, {{2017, 2, 1}, 2}};
nonDatePlot = ListPlot[data[[All, -1]]];
tks = Ticks /. AbsoluteOptions[nonDatePlot];
modifiedTks = 
  tks[[2]] /. {x_Real, tk_Real, rest___} :> {x, 
     Rationalize[tk/Pi, Pi/10000] Pi, rest};
DateListPlot[data, 
 FrameTicks -> {{modifiedTks, Automatic}, Automatic}]
POSTED BY: Gianluca Gorni
Posted 4 years ago

Hi, I am interested in this solution too. I would like to use human readable numeric values on my charts, not in scientific notation. I could not find how to do that. I am using Mathematica 12.1.1 Thanks!

POSTED BY: Alan Parson
Reply to this discussion
Community posts can be styled and formatted using the Markdown syntax.
Reply Preview
Attachments
Remove
or Discard

Group Abstract Group Abstract