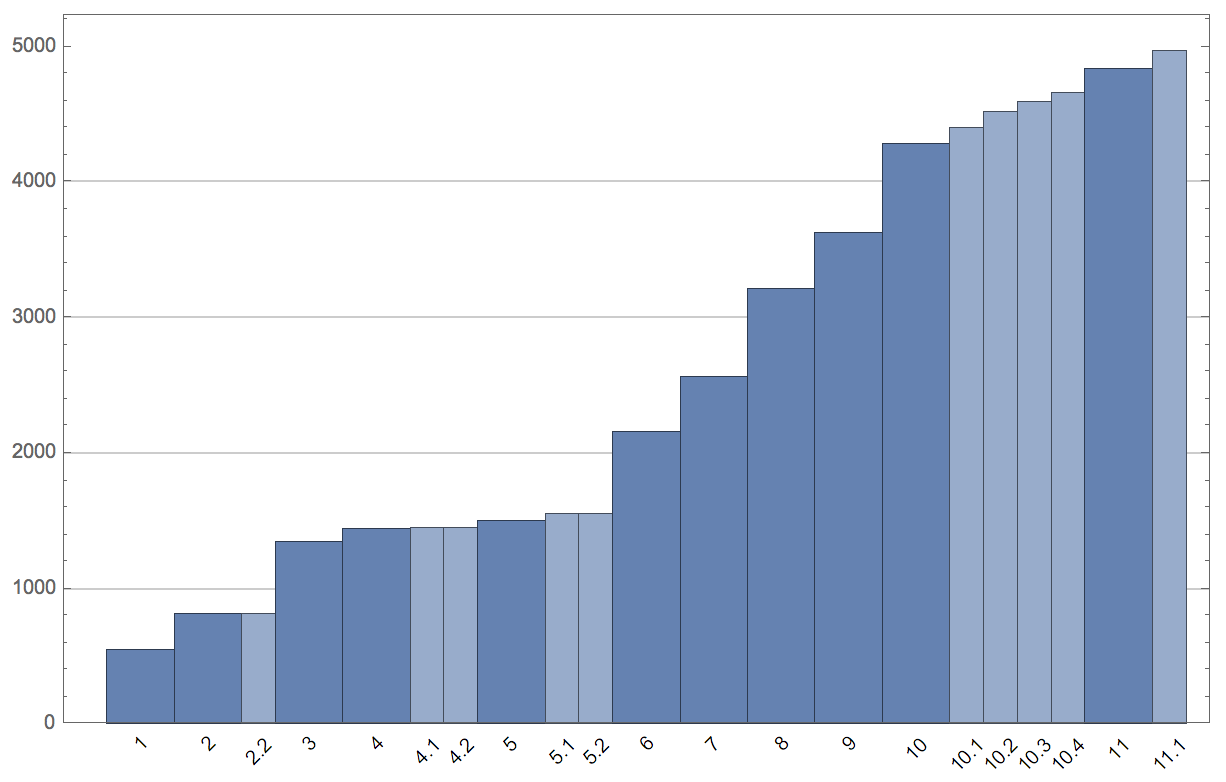
Here is a plot of the number of functions for each release:
funcs=WolframLanguageData[];
versions=WolframLanguageData[funcs,"VersionIntroduced"];
out=SortBy[Tally[versions],First];
out[[All,2]]=Accumulate[out[[All,2]]];
out={#1,{If[IntegerQ[#1],100,50],#2}}&@@@out;
blue=RGBColor[0.37,0.51,0.71];
cols=If[IntegerQ[#],blue,Lighter[blue]]&/@out[[All,1]];
RectangleChart[Labeled[#2,Rotate[#1,\[Pi]/4],Below]&@@@out,BarSpacing->0,ImageSize->600,ChartStyle->cols,Frame->True,GridLines->Automatic,FrameTicks->{{Automatic,Automatic},{None,None}}]
