Message Boards Message Boards

[Numberphile] - Abelian Sandpiles - Done in the Wolfram Language

enter image description here

Just a couple of days ago I posted about the Numberphile video about Frog Jumping (see here) where one of the forum members suggested I should check out the video about sandpiles.

enter image description here

If you haven't seen it already, you should. I must admit it is a fairly long video that starts off boring, but it is pure gold at the end. Anyhow, how can we do such calculations in the Wolfram Language I van Veen was wondering. So here we go.

We represent our sandpile as a simple matrix (following the example around 8:37 in the video):

a = sp[{{3, 3, 3}, {3, 3, 3}, {3, 3, 3}}]
b = sp[{{0, 0, 0}, {0, 1, 0}, {0, 0, 0}}]
c = a + b

If we execute this now, nothing really happens, that's because we have not yet told the computer how to add up sp objects. So let's add a definition:

ClearAll[sp]
sp[s_List] + sp[t_List] ^:= Module[{dim, r, tmp, neighbours},
  dim = Dimensions[s];
  r = s + t;
  While[Max[r] > 3,
   r = ArrayPad[r, 1, 0];
   tmp = Quotient[r, 4];
   r -= 4 tmp;
   r += RotateLeft[tmp, {0, 1}] + RotateLeft[tmp, {1, 0}] + 
     RotateLeft[tmp, {0, -1}] + RotateLeft[tmp, {-1, 0}];
   r = ArrayPad[r, -1];
   ];
  sp[r]
  ]

What is done here, is the following:

  1. Add up the raw matrices
  2. While there is a number still above 3 loop:
  3. Pad the entire matrix with 0s around it
  4. Calculate Floor[values/4], this is done using quotient, and gives a matrix of the number that can be toppled, and how many times it can be toppled.
  5. Subtract 4 times this matrix.
  6. Add shifted version of this matrix to redistribute the sand to the neighbours (using RotateLeft).
  7. Remove the padding again using Arraypad[...,-1]

Note that I have to use :^= rather than := because Plus is protected by default. Moreover, I don't want to touch the definition of Plus, so by using ^:= the definition is added to sp rather than Plus. I also tried out several other different methods, I found this was one of the fastest ways. Other options included using Position, finding the neighbours and subtracting manually, convolutions, or using BlockMap. Perhaps one could even coerce CellularAutomaton to do it for you.

Now that we have addition figures out, we can re-execute our above code:

a = sp[{{3, 3, 3}, {3, 3, 3}, {3, 3, 3}}];
b = sp[{{0, 0, 0}, {0, 1, 0}, {0, 0, 0}}];
c = a + b

sp[{{1, 3, 1}, {3, 0, 3}, {1, 3, 1}}]

So it is working! Now make some convenient functions to make it look nicer:

colorrules = {0 -> Black, 1 -> Yellow, 2 -> Blue, 3 -> Red, _Integer -> Pink};
Format[sp[t_]] := ArrayPlot[t /. colorrules, ImageSize -> 200, Frame -> False]

Using Format we can tell the Wolfram Language how to show an sp object. Re-executing now gives us an image, rather than a dull matrix:

enter image description here

However we can not get the data from such an image any more, so it is a good idea to define a Normal and some other functions as well, here the total code:

ClearAll[sp]
sp[x_SparseArray]:=sp[Normal[x]]
Normal[sp[s_List]]^:=s
sp[s_List]+sp[n_Integer]^:=sp[s]+sp[ConstantArray[n,Dimensions[s]]]
sp[s_List]+sp[t_List]^:=Module[{dim,r,tmp,neighbours},
    dim=Dimensions[s];
    r=s+t;
    While[Max[r]>3,
        r=ArrayPad[r,1,0];
        tmp=Quotient[r,4];
        r-=4tmp;
        r+=RotateLeft[tmp,{0,1}]+RotateLeft[tmp,{1,0}]+RotateLeft[tmp,{0,-1}]+RotateLeft[tmp,{-1,0}];
        r=ArrayPad[r,-1];
    ];
    sp[r]
]
colorrules={0->Black,1->Yellow,2->Blue,3->Red,_Integer->Pink};
Format[sp[t_]]:=ArrayPlot[t/.colorrules,ImageSize->200,Frame->False]

Now we can type:

Normal[c]

to get the values again:

{{1, 3, 1}, {3, 0, 3}, {1, 3, 1}}

Or add a constant sandpile:

sp[{{3, 3, 3}, {3, 3, 3}, {3, 3, 3}}] + sp[1]

enter image description here

So let's create the iconic image the Numberphile video showed:

n = 100;
u = sp[ConstantArray[6, {n, n}]];
start = AbsoluteTime[];
u = u + sp[0];  (* the addition of 0 will trigger the toppling *)
out = u = sp[ConstantArray[6, {n, n}] - Normal[u]] + sp[0]
{n, AbsoluteTime[] - start}

Letting it run takes a few seconds:
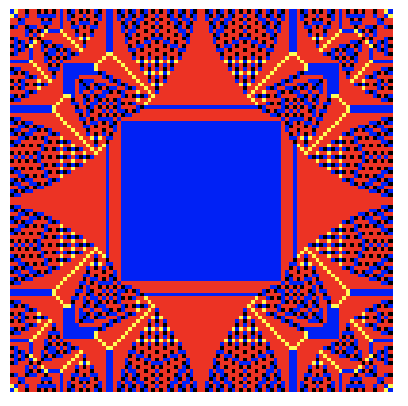
enter image description here

Or run it for large n = 512:

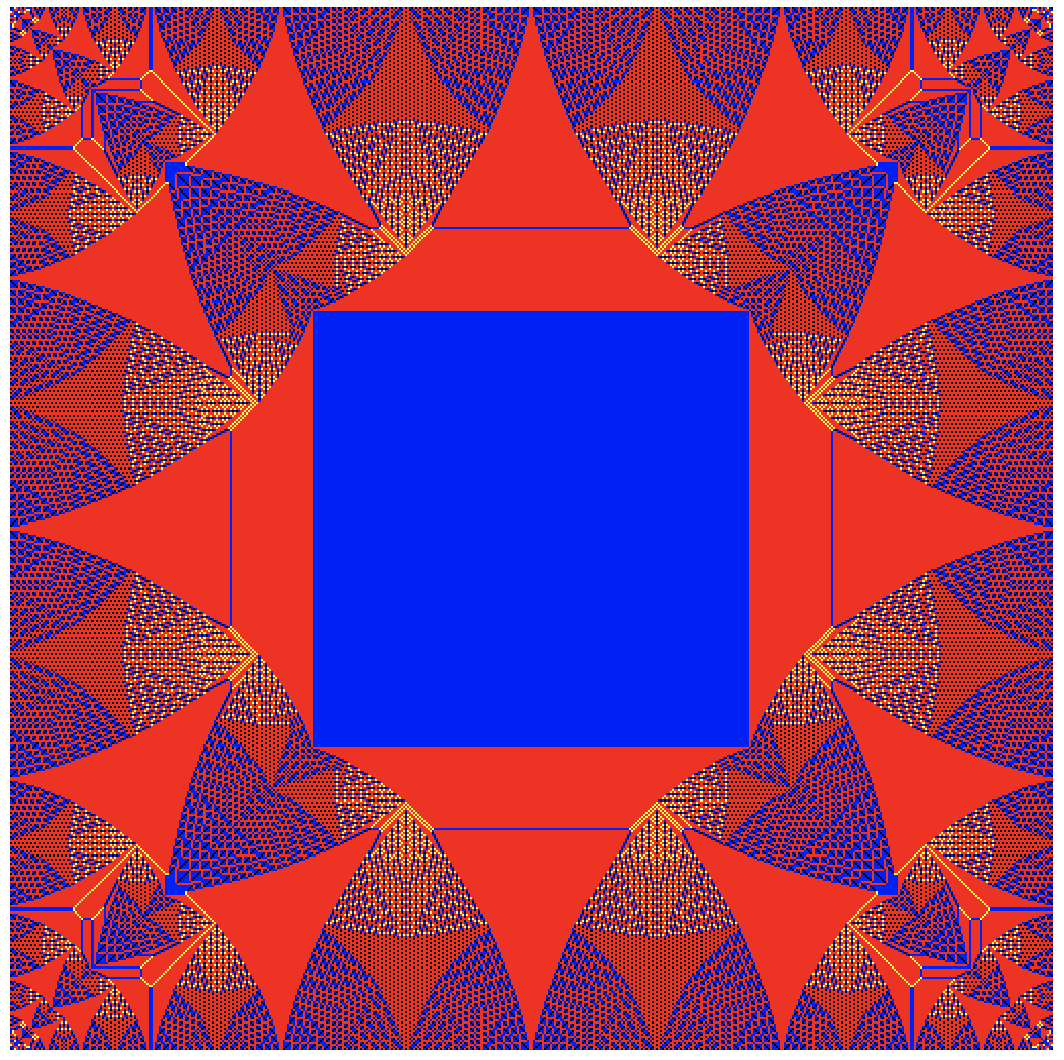
enter image description here

The authors also shows what happens when you put a large pile of sand on a single cell and see how it spreads, we can do that too:

u = sp[CenterArray[50000, {201, 201}]];
AbsoluteTiming[out = u + sp[0];]
out
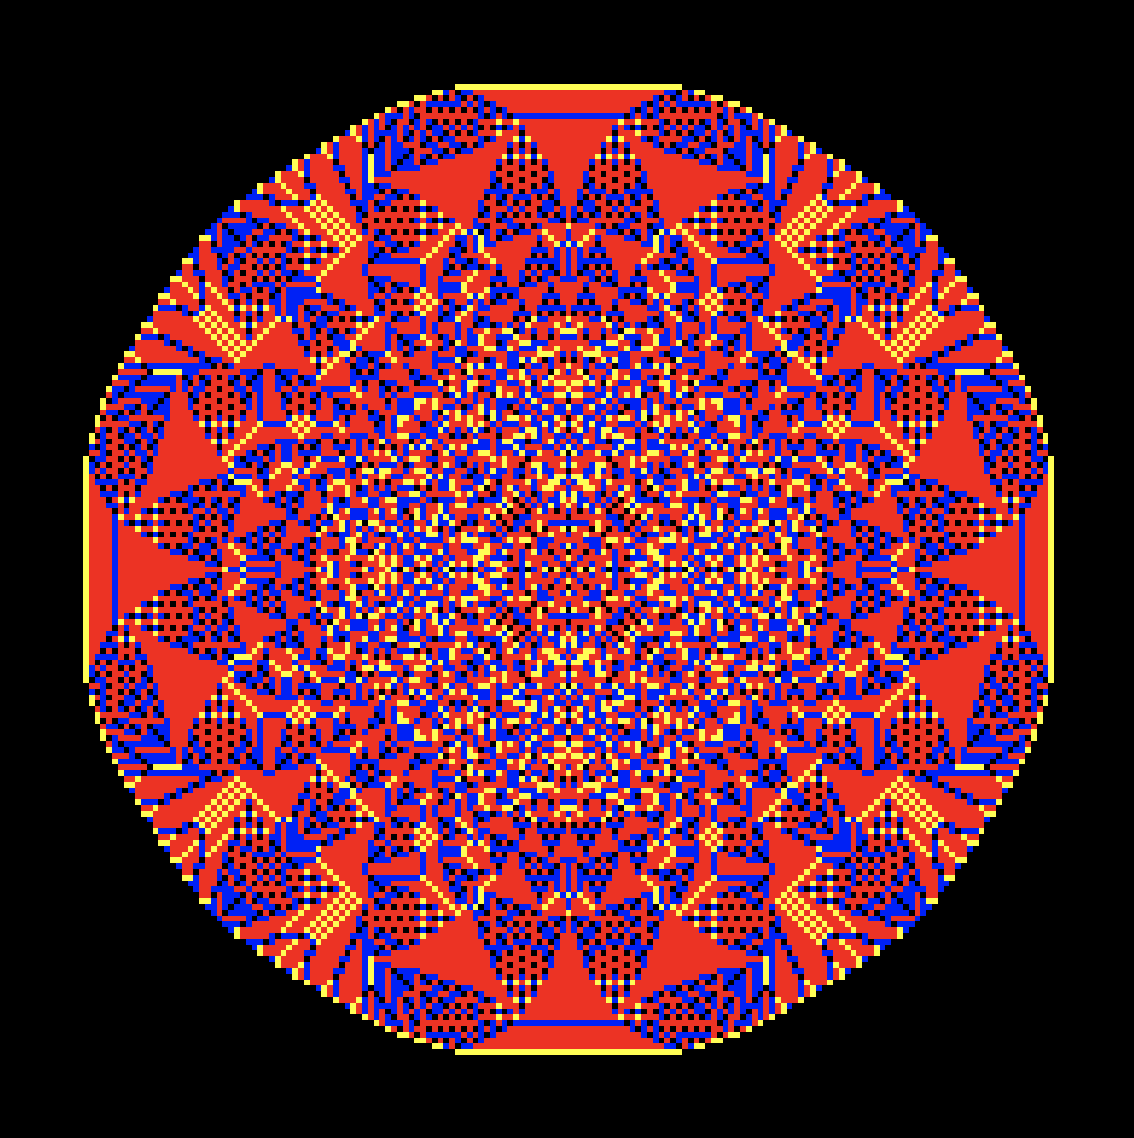
enter image description here

Note that for larger numbers of sand it will take longer and longer to converge; this is because sand will take a long time to reach the edge of the matrix. The grid increases as n^2, but the border only as n. So it becomes harder and harder to lose sand. I'm not completely sure how to speed up the code without going through all the calculations...

Hope you enjoyed this, now that you have the basic code, one can try non-rectangular patterns, different neighbourhoods, et cetera. Also check out the other Numberphile inspired posts:

POSTED BY: Sander Huisman
12 Replies

Hi Sander, Really great a I learned a lot from it! Many thanks!! And indeed the video starts a bit boring/puzzled (like where is this getting to) but is very nice at the end. Thanks!

POSTED BY: l van Veen

I don't often use ^:= but this was a good point to use it. Though I guess one could also use TagSet, not sure though. Both I only use once a year or so haha. Also I thought it would be a good idea to show the Format[...] 'trick', most people don't know about it, but can be very useful to see what is going on...

POSTED BY: Sander Huisman

enter image description here - Congratulations! This post is now a Staff Pick! Thank you for your wonderful contributions. Please, keep them coming!

POSTED BY: EDITORIAL BOARD

Thanks!

POSTED BY: Sander Huisman

You won the price :) If you're going to the tech event in Amsterdam I'll buy you a beer!

POSTED BY: l van Veen

You can easily generalize for n dimensions by (albeit incredible slow!!!!):

ClearAll@Sandpile    
Sandpile[x_SparseArray] := Sandpile@Normal@x
Normal@Sandpile[s_List] ^:= s    
Sandpile /: Sandpile[a_List] + Sandpile[n_Integer] := Sandpile@a + Sandpile[ConstantArray[n, Dimensions@a]]
Sandpile /: Sandpile[a_List] + Sandpile[b_List] /; Dimensions@a === Dimensions@b := Module[
  {sum, temp, rest, sides},
  sum = a + b;      
  sides = Permutations@Append[ConstantArray[0, {ArrayDepth@a - 1}], 1];
  sides = Join[sides, -sides];
  While[Max@sum >= 4,
   sum = ArrayPad[sum, 1, 0];
   temp = Quotient[sum, 4];
   sum -= 4 temp;
   sum += Total[RotateLeft[temp, ##1] & /@ sides];
   sum = ArrayPad[sum, -1]
   ];
  Sandpile@sum
  ]

Sandpile$Colors = {0 -> Black, 1 -> Yellow, 2 -> Blue, 3 -> Red, _Integer -> Pink};
Format[Sandpile[t_List /; ArrayDepth@t <= 2]] := ArrayPlot[If[ArrayDepth@t == 1, {t}, t] /. Sandpile$Colors, 
  ImageSize -> 400, Frame -> False]
Format[Sandpile[t_List /; ArrayDepth@t == 3]] := ListDensityPlot3D[t, ImageSize -> 400, Axes -> False,
  ColorFunction -> (Blend[{{0, Black}, {1, Yellow}, {2, Blue}, {3, Red}}, #] &),
  ColorFunctionScaling -> False, SphericalRegion -> True, Boxed -> False]
POSTED BY: Thales Fernandes

Thanks for sharing! Unit directions can also be created using:

UnitVector[3, #] & /@ Range[3]

But using permutations is also quite neat actually... I'm not sure if '4' should be the toppling value for all dimensions; I think it should be equal to the number of neighbours. So for squares: 2 in 1D, 4 in 2D, 6 in 3D et cetera. There are examples with hexagons (in 2D), where they take 6 as the toppling value...

I'm not quite sure why it is so slow though... maybe because sand is created because of the '4' thing.

Maybe you can explain me the difference between definition of the forms:

Sandpile /: Sandpile[a_List] + Sandpile[n_Integer] :=  ...
Sandpile[a_List] + Sandpile[n_Integer] ^:=  ...

I'm not very cognisant on this...

POSTED BY: Sander Huisman

I'm not sure if I will be able to attend it. I know it is very close from France, but well... I will let you know if I do go.

POSTED BY: Sander Huisman

Thanks for sharing! Unit directions can also be created using:

UnitVector[3, #] & /@ Range[3]

Clever!

I'm not sure if '4' should be the toppling value for all dimensions

In my 30 seconds deep internet research (Wikipedia) I couldn't find anything about the toppling number and dimensionality, I guessed it could be the number of neighbors too, but...

Maybe you can explain me the difference between definition of the forms:

No difference whatsoever in this case. I just don't like using ^:= (If that is a good enough reason, lol), and in some situations the upvalues are shared among different variables, therefore it offers more "control" (says the guy who likes excessive use of @!).

POSTED BY: Thales Fernandes

For me it's just conservation of sand; if you add '1' sand to all your neighbours, you should take away 'neighbours' amount of sand in the centre... annihilating of magically creating sand is not good I guess...

ok ok, I'm still a bit confused on the syntax, but if she works she works... all good.

POSTED BY: Sander Huisman

For me it's just conservation of sand

As a physicist myself, I'm ashamed I haven't thought that...

Perhaps a better generalization would've be a graph, where a node topple its content to its neighbors if it has more sand than neighbors and the outer nodes (boundary) works as a dump site, where it can hold an infinite amount of sand without toppling.

I'm still a bit confused on the syntax

You can find more info at stackexchange. I just prefer TagSet over UpSet, since it makes more obvious what upvalues you are modifying.

POSTED BY: Thales Fernandes

Great! I found a C++ implementation and use it with LibraryLink template to simulate when you put a large pile of sand on a single cell:

https://community.wolfram.com/groups/-/m/t/1927307

POSTED BY: Shenghui Yang
Reply to this discussion
Community posts can be styled and formatted using the Markdown syntax.
Reply Preview
Attachments
Remove
or Discard

Group Abstract Group Abstract