Message Boards Message Boards

2
|
4312 Views
|
4 Replies
|
6 Total Likes
View groups...
Share
Share this post:

How to show a limit superimposed on a graph

Posted 11 years ago
I'd like to Plot the following graph with the Limit superimposed on it.  If I enter the following as freeform, then the suggestions back from Alpha include exactly the graph I'm looking for with a red circle showing the limit, but I can't figure out how to make Mathematica create the same chart.
Plot[(x - 5)/(x^2 - 25), {x, -2.752, 12.752}]
Limit[(x - 5)/(x^2 - 25), x -> 5]
Any suggestions gratefully received.
POSTED BY: Peter Brown
4 Replies
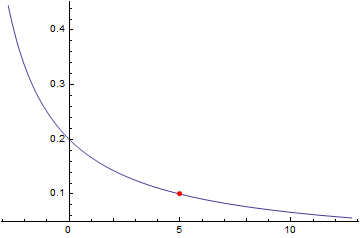
First, set your xlim and ylim values:
xlim = 5;
ylim = Limit[(x - 5)/(x^2 - 25), x -> xlim];
Then, use Epilog to draw a dot:
Plot[(x - 5)/(x^2 - 25), {x, -2.752, 12.752},
Epilog -> {AbsolutePointSize[5], Red, Point[{xlim, ylim}]}]

Or to draw a circle:
Plot[(x - 5)/(x^2 - 25), {x, -2.752, 12.752}, Epilog -> {Red, Circle[{xlim, ylim}, Scaled[{.02/GoldenRatio, .02}]]}]

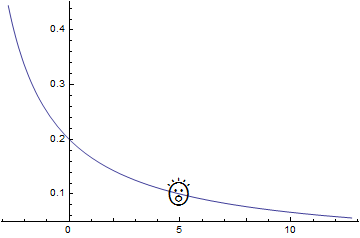
Or something more fun:
Plot[(x - 5)/(x^2 - 25), {x, -2.752, 12.752},
Epilog -> {Text[Style["\[FreakedSmiley]", 36], {xlim, ylim}]}]
POSTED BY: Arnoud Buzing
You could also search Demonstration Project - our largest online repository of interactive code published by users - all open source. So click on this LINK to see the search results. There are many apps there on the topic of limits - you can view, download and update code easily. There is also huge general calculus section. I think most suitable Demonstration for you on limits is: Finite Limit at a Finite Point


POSTED BY: Vitaliy Kaurov
Another functionality to consider is integration with Wolfram|Alpha. So of course you could just do this on W|A site: LINK. But if you want to get the graph in Mathematica then this simple thing will do (note it is just natural langauge query and the graph is interactive and you can see the steps):
WolframAlpha["limit (x - 5)/(x^2 - 25) for x -> 5"]

POSTED BY: Vitaliy Kaurov
Posted 11 years ago
Arnoud, thanks much, Epilog is exactly what I'm looking for and thanks for your multiple examples.

Vitaly, thanks for your answers.  I had taken a look in the demonstrations projects but it's hard to find demonstrations of the simple stuff for beginners like me.  I had checked the freeform Alpha and got that graph you showed, but when I pulled the code back into Mathematica it didn't draw that red circle, and my son needs to save to PDF for his teacher so I wanted it in Mathematica.

Thanks all, question answered.
POSTED BY: Peter Brown
Reply to this discussion
Community posts can be styled and formatted using the Markdown syntax.
Reply Preview
Attachments
Remove
or Discard

Group Abstract Group Abstract