Group Abstract Group Abstract

Message Boards Message Boards

2
|
20.8K Views
|
4 Replies
|
8 Total Likes
View groups...
Share
Share this post:

Plotting 3D Surface Intersections as 3D Curves

Posted 12 years ago
As a project to brighten my retirement, I am trying to achieve the following and need some (a lot of) help. Given two 3D surfaces expressed as two 3D equations whose domains cause the 2 surfaces to intersect, plot the resulting 3D curve of intersection. My simplest example has one of the surfaces as a reference sphere and the other as a circular cylinder whose size and location can be adjusted for study. The final plot would show only the reference sphere with the curve of intersection on its surface.

Someone has probably done this already, but I can't seem to find it anywhere in the Community or the Virtual Book. There is something called a Viviani Curve in Wolfram Alpha which comes close, but I cannot understand their notation.

Any help would be greatly appreciated.
Thanks, Ed

 
POSTED BY: Ed Frank
4 Replies
POSTED BY: Arben Kalziqi
Posted 2 years ago
POSTED BY: Phil Earnhardt
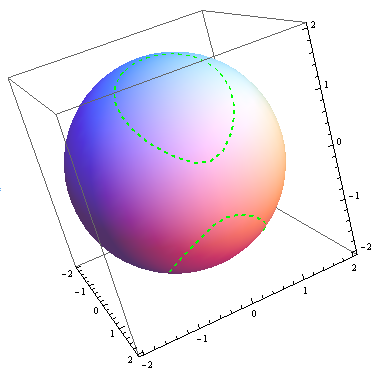
Here is a nice approach using ContourPlot3D (source):

ContourPlot3D[{x^2 + y^2 + z^2 - 4, (x - 1)^2 + y^2 - 7/8}, {x, -2, 2}, {y, -2, 2}, {z, -2, 2},
     ContourStyle -> {Automatic, Opacity[0]}, Mesh -> None,
     BoundaryStyle -> {2 -> None, {1, 2} -> {Green, Thick, Dashed}}]

POSTED BY: Ilian Gachevski
Reply to this discussion
Community posts can be styled and formatted using the Markdown syntax.
Reply Preview
Attachments
Remove
or Discard