Message Boards Message Boards

Read SEGY data in Mathematica?

Posted 6 years ago

Please I need code/software to read SEGY data in order to input to Mathematica

POSTED BY: Oluseun Sanuade
13 Replies

Hi people! I am trying to understand what some commands does in Mathematica but I do not understand yet. I have attached the code to this write u[. I know what each of the terms means but I need to understand what each command does. I want to know how the command will perform each function.

Thank you.

Attachments:
POSTED BY: Oluseun Sanuade

Please see advanced dedicated post @Kirill Belov kindly contributed:

Working with SEGY file format for storing geophysical data

http://community.wolfram.com/groups/-/m/t/1283198

POSTED BY: Moderation Team
Posted 6 years ago

First of all you need - download repository. Second - open and evaluate Installer.nb notebook. Third -you can create your own new notebook for working and evaluate

Get["CustomImportExport`"] 

For import file evaluate next

dataIn = CustomImport["YourFileName.sgy", "SEGY"]

You can see and analyze headers of traces

dataIn["TraceHeaders", 1;;-1, {"gx", "gy"}]

in this string we can see coordinates of geophones. In this package SeismicUnix notation of headers is used. In next string you can get the values of first trace

dataIn["Traces", 1]

You can plot data (Seismic section or Gathers) by the way Christopher showed. If you have questions - please write!

POSTED BY: Anton Ekimenko

Thank you Anton, I have been able to do that successfully.

POSTED BY: Oluseun Sanuade

Thank you Anton. I was able to load the data successfully but the ArrayPlot did not work. Kindly highlight to me how to do the plotting after loading the SEGY data.

POSTED BY: Oluseun Sanuade
Posted 6 years ago

It was a small mistake in the documentation. Try this:

data = CustomImport["path/to/file.segy", "SGY"]

ArrayPlot[data]
ArrayPlot[data["Traces"][]]

(* data["Traces"][] - returns array of numbers *)

Or you can download latest version of the package (I updated this several days ago) and code from the ExampleOfUse will be work.

POSTED BY: Kirill Belov
Posted 6 years ago

If you mean the SEGY seismic data format I can recomend to use this project https://github.com/KirillBelovTest/CustomImportExport This package allows you to import and export seismic data into the Mathematica, to work with the trace headers and text headers. It supports both the data format floating-point and integer data. You can dowload repository and find some examples. The comments are on Russian but a think you can understand the code easily. If you would like to improve this project, can you tell us about your wishes and to participate in development.

POSTED BY: Anton Ekimenko

Thank you Anton for sharing these codes with me. This is exactly what I need, to be able to read SEGY data into the Mathematica. However, I will appreciate if you could help with English version of step-by-step guide to use it. I am a new user of Mathematica. Thank you once again

POSTED BY: Oluseun Sanuade

Thank you for sharing this interesting body of work. I installed the package as per the instructions and am exploring the examples. As it happens the first one I tried, from the file "ExampleOfUse.md" has a minor issue. The code:

Get["CustomImportExport`"];
SetDirectory[$CustomImportExportDirectory];
file = FileNameJoin[{"CustomImportExport", "Resources", 
    "MarmousiModel.segy"}];
data = CustomImport[file, "SEGY"];
traces = data["Traces"];Head[traces]  (* check the form of traces *) 

SEGYElement

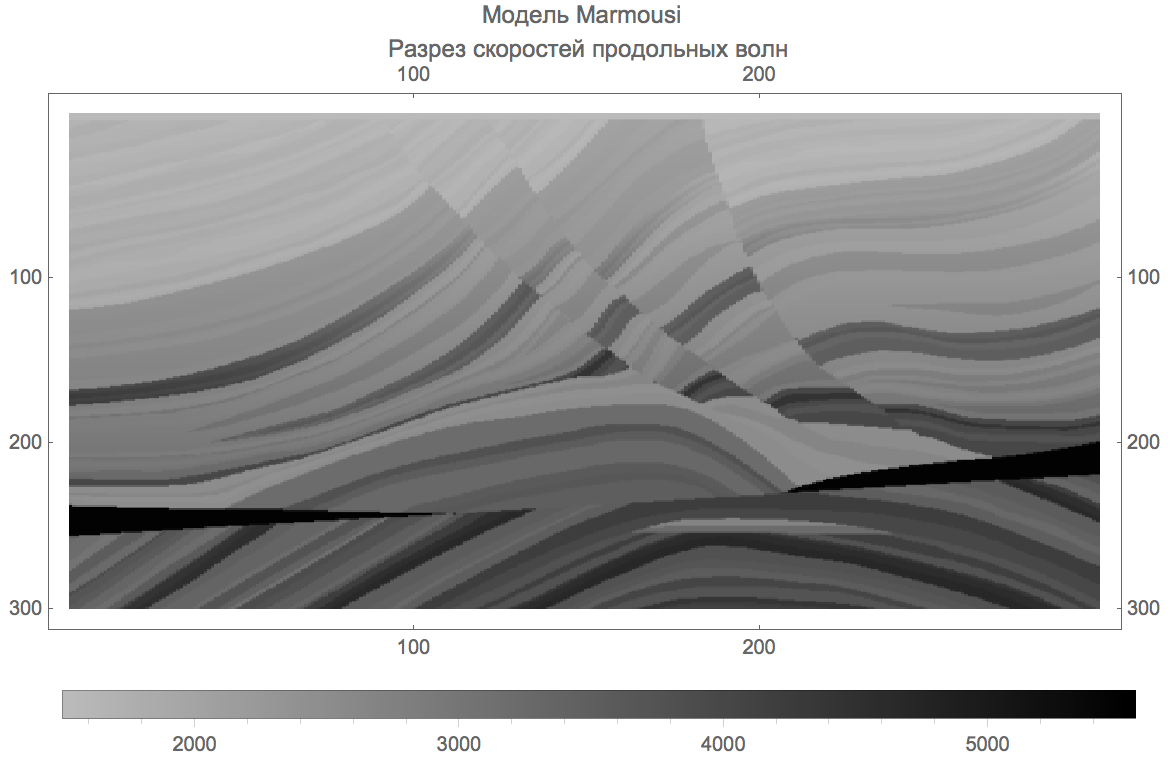
So the following ArrayPlot fails unless we take the second part of "traces", and now it works very nicely.

ArrayPlot[Transpose[traces[[2]]], AspectRatio -> 0.5, 
 ImageSize -> Large, PlotLegends -> Automatic, 
 FrameTicks -> Automatic, 
 PlotLabel -> "?????? Marmousi \n ?????? ????????? ?????????? ????"]

enter image description here

Hi Christopher! I am new to Mathematical, kindly highlight the steps to follow in order to read SEGY file into Mathematical.

Thank you

POSTED BY: Oluseun Sanuade
Posted 6 years ago

Thanks for finding the bug! I fixed this. In fact, there is a small inaccuracy in the documentation. Now you can use the function ArrayPlot like this:

data = CustomImport["path/to/file.segy", "SGY"]

ArrayPlot[data]
ArrayPlot[data["Traces"]]

More examples in the file CustomImportExport.nb

POSTED BY: Kirill Belov

Dear Anton, I am working on velocity analysis (stacking velocity) using mathematica. However, I applied my code on the traces but it did not work. Of course I know why it did not work because my data has to be in CMP. Can the customExport expository do sorting? If not could you please advice on how to sort my data into CMP. Thank you.

POSTED BY: Oluseun Sanuade

I don't know if this is helpful, but there is an R package called Rquake

https://cran.r-project.org/web/packages/Rquake/Rquake.pdf

that looks like it is built to to read in seg-y data. Mathematica has a good interface with the R Language via RLink:

http://reference.wolfram.com/language/RLink/tutorial/UsingRLink.html

So, although it may not be a trivial exercise to add in this package to R and then to interface with Mathematica using RLink, it may be simpler than trying to write some kind of seg-y parsing code in regular Mathematica.

POSTED BY: Seth Chandler
Reply to this discussion
Community posts can be styled and formatted using the Markdown syntax.
Reply Preview
Attachments
Remove
or Discard

Group Abstract Group Abstract