Message Boards Message Boards

0
|
5272 Views
|
3 Replies
|
2 Total Likes
View groups...
Share
Share this post:

[?] Add a color legend to a contour plot?

Posted 6 years ago

Here is a command that generates a temp vs x and y.

It gives a nice 3 d contour with color shading, but no legend that says what. Value is assigned to each color.

Plot3D[ufun[x, y], {x, xlow, xhigh}, {y, ylow, yhigh}, ColorFunction -> "TemperatureMap"]

What to add to get the color legend?

3 Replies

Hi,

this is not particularly good, but I think it might work. I generate a list of frames and animate them so that it becomes clear that the colour bar is the same as the values of the function change:

ufun[x_, y_] := Cos[(x^2 + y^2)] Exp[-0.1 (x^2 + y^2)]
{xlow, xhigh} = {-6, 6};
{ylow, yhigh} = {-6, 6};

Monitor[frames = 
Table[GraphicsRow[{Plot3D[a ufun[x, y], {x, xlow, xhigh}, {y, ylow, yhigh}, ColorFunction -> (ColorData["TemperatureMap"][Rescale[#3, {-1.5, 1.5}]] &), ColorFunctionScaling -> False, PlotPoints -> 40, PlotRange -> {All, All, {-2, 2}}], 
BarLegend[{"TemperatureMap", {-1.5, 1.5}}]}, ImageSize -> Large,Alignment -> {{Center, Left}}], {a, 1, 1.5, 0.02}];, a]
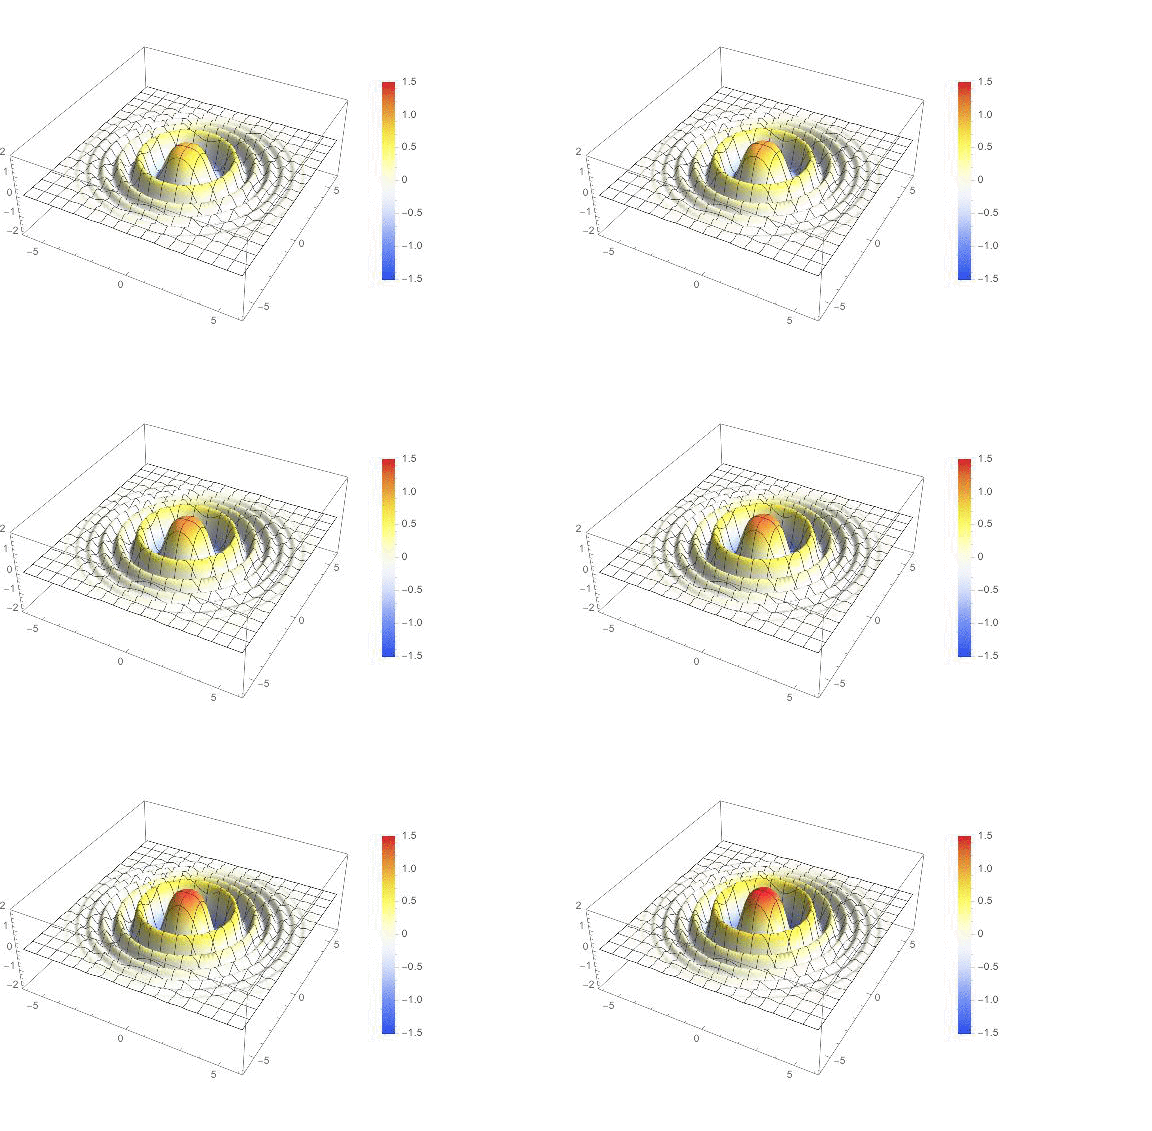
enter image description here

This can be done easier, but the code gives you quite some control about nearly all parts of the image.

Cheers,

Marco

POSTED BY: Marco Thiel

Thanks for the answer!!

I would like to force the high and low color cutoffs of the function being plotted so that when I compare two similar plots, red, blue ...etc means the same numerical value in both plots. How would you do that?

Thanks in advance

Hi,

let me try to give a slightly more specific example:

ufun[x_, y_] := Cos[(x^2 + y^2)] Exp[-0.1 (x^2 + y^2)]
{xlow, xhigh} = {-6, 6};
{ylow, yhigh} = {-6, 6};
Plot3D[ufun[x, y], {x, xlow, xhigh}, {y, ylow, yhigh}, ColorFunction -> "TemperatureMap", PlotPoints -> 50, PlotRange -> All, PlotLegends -> Automatic]

enter image description here

Is that what you are looking for? That is, of course, not a ContourPlot. A ContourPlot would look like this:

ContourPlot[ufun[x, y], {x, xlow, xhigh}, {y, ylow, yhigh}, ColorFunction -> "TemperatureMap", PlotRange -> All, Contours -> 50, PlotLegends -> Automatic, ContourStyle -> None]

enter image description here

Cheers,

Marco

POSTED BY: Marco Thiel
Reply to this discussion
Community posts can be styled and formatted using the Markdown syntax.
Reply Preview
Attachments
Remove
or Discard

Group Abstract Group Abstract