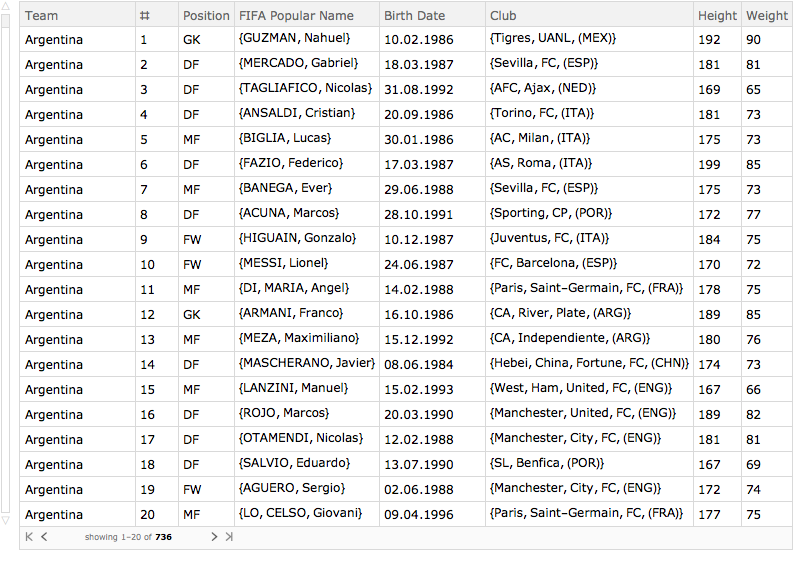
Great post @Francisco thank you for sharing! Perhaps we can get a more accurate prediction if we include info about each player. Fifa provides some nice info about the 700+ players that will participate in the World Cup https://www.fifa.com/worldcup/players/ . So I created the following dataset (see it attached):
datasetWC18 = Import["WC18PlayersDataset.m"]
Age of the players might be a relevant feature. But the most relevant info is still missing .... players market value and achievements within their clubs (there are several places where this info is available, but I haven't had time to include it).
Anyway let's do some nice visualization with this players dataset as a start. For example I was curious about the correlation between "Height" / "Weight" and their "Field Position". The results are the following (Note that I'm using ListPointPlot3D to associate a 3rd dimension to players indicating their "Field Position") :
fieldPositions = {"GK", "DF", "MF", "FW"};

ListPointPlot3D[
    Table[
            Map[Append[#, "PositionN" -> i] &,
                    datasetWC18[Select[#Position == fieldPositions[[i]] &], {"Height", "Weight"}]
                    ]
      , {i, 4}],
 ImageSize -> 800,
 PlotStyle -> PointSize[0.012],
 PlotLegends -> SwatchLegend@{Style["Goalkeepers", 18], Style["Defenders", 18],   Style["Midfielders", 18], Style["Forwards", 18]},
 AxesLabel -> {Style["cm", 18, Bold], Style["kg", 18, Bold]},
 PlotLabel -> Style["Players height vs weight", 20, Bold]]
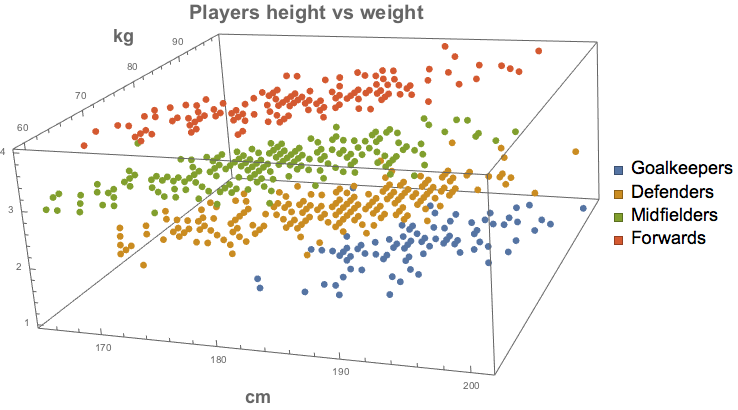
As expected the Goalkeepers on average are the tallest and heaviest. What I wasn't expecting was that on average the Midfielders are the smallest. Perhaps it is because Midfielders best asset is their strategic mind to orchestrate the game from the middle with clever ball passes.
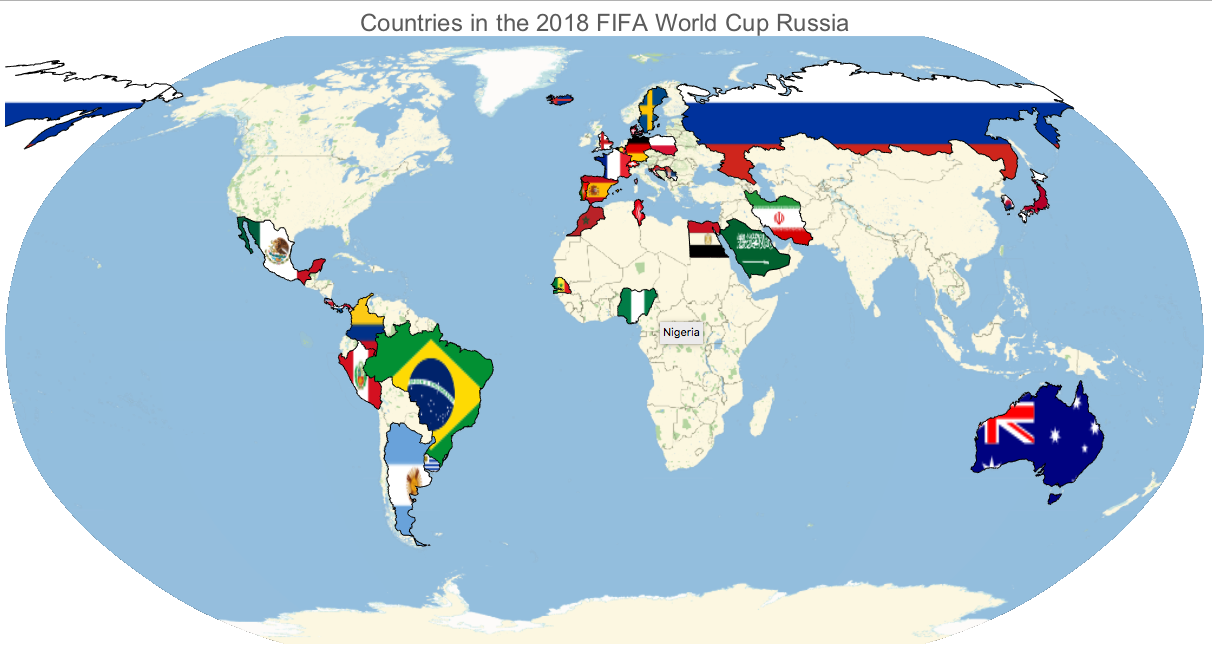
Projecting the flags of World Cup countries
Borrowing Francisco's code for countries entities one can easily get all their flags, except the one from England which is missing (so, I added it manually):
countries = {Entity["Country", "Russia"],
   Entity["Country", "SaudiArabia"], Entity["Country", "Egypt"],
   Entity["Country", "Uruguay"], Entity["Country", "Portugal"],
   Entity["Country", "Spain"], Entity["Country", "Morocco"],
   Entity["Country", "Iran"], Entity["Country", "France"],
   Entity["Country", "Australia"], Entity["Country", "Peru"],
   Entity["Country", "Denmark"], Entity["Country", "Argentina"],
   Entity["Country", "Iceland"], Entity["Country", "Croatia"],
   Entity["Country", "Nigeria"], Entity["Country", "Brazil"],
   Entity["Country", "Switzerland"], Entity["Country", "CostaRica"],
   Entity["Country", "Serbia"], Entity["Country", "Germany"],
   Entity["Country", "Mexico"], Entity["Country", "Sweden"],
   Entity["Country", "SouthKorea"], Entity["Country", "Belgium"],
   Entity["Country", "Panama"], Entity["Country", "Tunisia"],
   Entity["AdministrativeDivision", {"England", "UnitedKingdom"}],
   Entity["Country", "Poland"], Entity["Country", "Senegal"],
   Entity["Country", "Colombia"], Entity["Country", "Japan"]};

flags = EntityValue[countries, "Flag"];
flagsAll = (flags /. {x_Missing -> englandFlag})
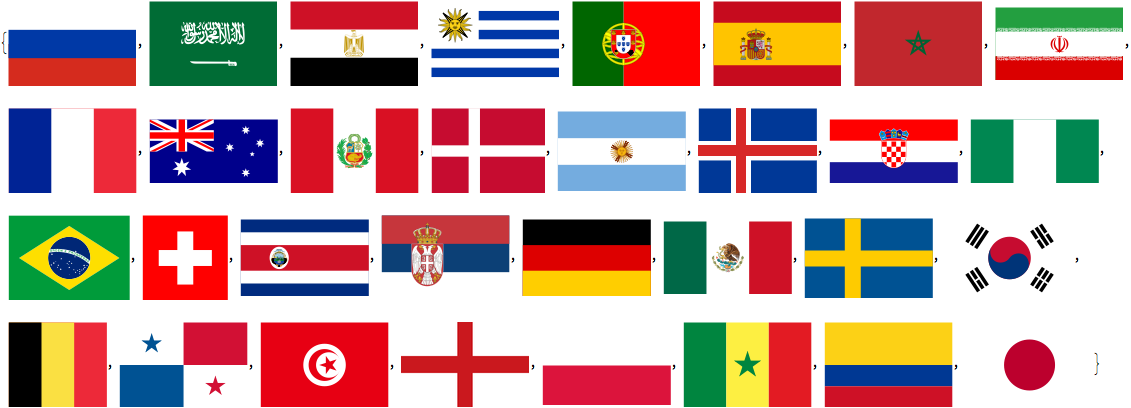
Finally with GeoGraphics we can create an interactive map using Tooltip as follows:
GeoGraphics[
{EdgeForm[ Directive[Thin, Black]],
{GeoStyling[{"Image", #2}], Tooltip[Polygon[#1], CommonName[#1]]} & @@@ Transpose[{countries, flagsAll}]},
Background -> "CountryBorders",
GeoProjection -> "Robinson", ImageSize -> 1200,
PlotLabel ->  Style["Countries in the 2018 FIFA World Cup Russia", 24]]
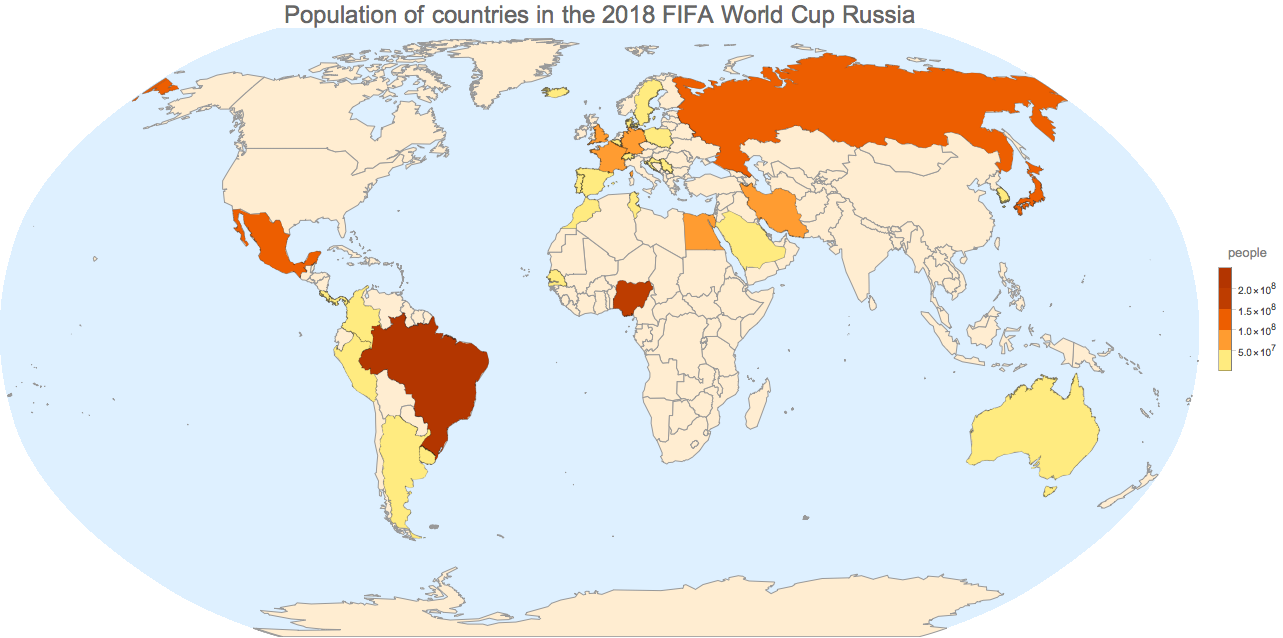
Population of countries in the 2018 FIFA World Cup
In my opinion two other interesting features to look for in the participating countries are their Population and GDP. Which can be easily obtained using EntityValue :
valsPopulation = EntityValue[countries, "Population"];
GeoRegionValuePlot[Thread[countries -> valsPopulation],
 GeoBackground -> "CountryBorders", GeoProjection -> "Robinson",
 ImageSize -> 1200, PlotLabel ->  Style["Population of countries in the 2018 FIFA World Cup Russia",  24]]
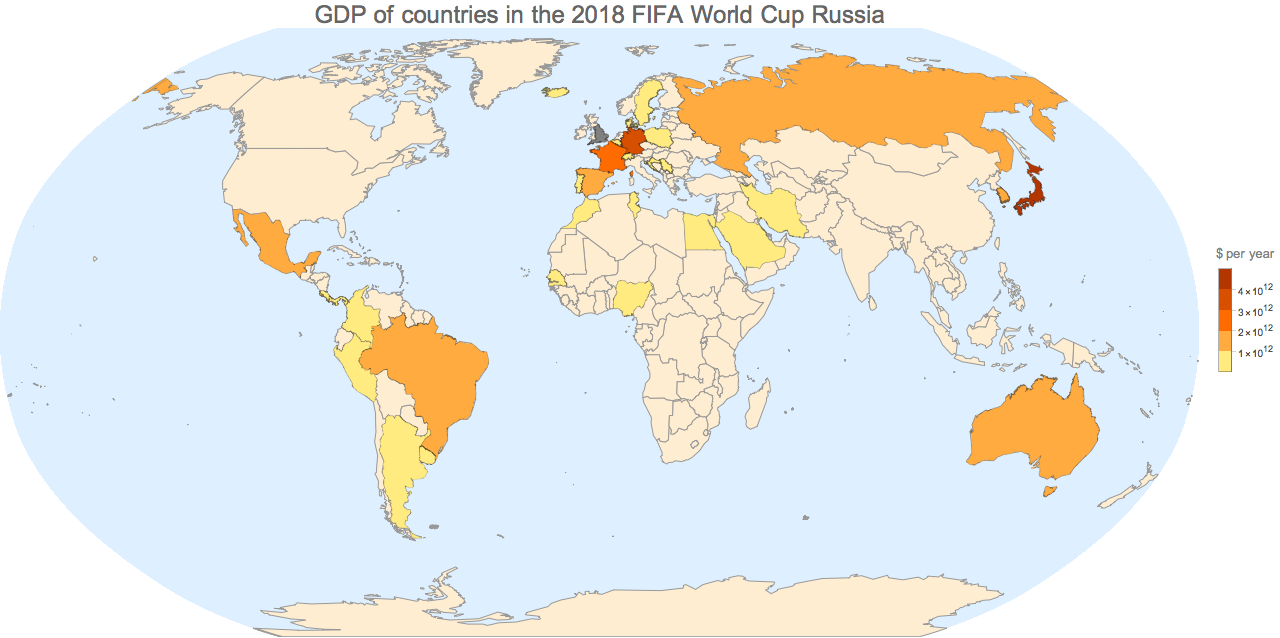
GDP of countries in the 2018 FIFA World Cup
valsGDP = EntityValue[countries, "GDP"];

GeoRegionValuePlot[Thread[countries -> valsGDP],
 GeoBackground -> "CountryBorders", GeoProjection -> "Robinson",
 ImageSize -> 1200, PlotLabel -> Style["GDP of countries in the 2018 FIFA World Cup Russia", 24]]
 Attachments:


