This June 14, 2018 starts the FIFA World Cup in Russia. After reading El País predition (see (1) and (2)), I wondered if I could build my own simulation using Wolfram Language. So here it is what I tried. Any new ideas on how to improve it are welcome, and let the best win!
Introduction
I will build this simulation by blocks:
- Base data
- Simulation of a match
- Simulation of the groups phase
- Simulation of the second phase
- All together
1. Base data
1.1. Rankings
As a base for this model, I will use the FIFA ranking. We could also do a test using other rankings (like the one generated by El País (2)).
I've downloaded the ranking from FIFA, and after using Interpreter["Country"] on all the names, I could get most of the countries properly parsed. Of course, we all know UK is not united for football, so I used Interpreter["AdministrativeDivision"] for the UK home nations, and a few other cases needed special threatment (like the case of Tahiti, which is not a proper country, so I did align it with Tahiti Islands, or Congo vs Congo DR, which need special disambiguation). Here I will attach the result of that ranking, so we should just load it:
rankingPoints = Dispatch[Get["rankingFifaJune7.m"]]
1.2. Participants and Groups
Using the previous alignment, I took the list from FIFA and converted into a simple list of countries.
countries = {Entity["Country", "Russia"],
  Entity["Country", "SaudiArabia"], Entity["Country", "Egypt"],
  Entity["Country", "Uruguay"], Entity["Country", "Portugal"],
  Entity["Country", "Spain"], Entity["Country", "Morocco"],
  Entity["Country", "Iran"], Entity["Country", "France"],
  Entity["Country", "Australia"], Entity["Country", "Peru"],
  Entity["Country", "Denmark"], Entity["Country", "Argentina"],
  Entity["Country", "Iceland"], Entity["Country", "Croatia"],
  Entity["Country", "Nigeria"], Entity["Country", "Brazil"],
  Entity["Country", "Switzerland"], Entity["Country", "CostaRica"],
  Entity["Country", "Serbia"], Entity["Country", "Germany"],
  Entity["Country", "Mexico"], Entity["Country", "Sweden"],
  Entity["Country", "SouthKorea"], Entity["Country", "Belgium"],
  Entity["Country", "Panama"], Entity["Country", "Tunisia"],
  Entity["AdministrativeDivision", {"England", "UnitedKingdom"}],
  Entity["Country", "Poland"], Entity["Country", "Senegal"],
  Entity["Country", "Colombia"], Entity["Country", "Japan"]}
Given that it is sorted by groups, we could just use Partition and get the teams per group:
teamsByGroup = AssociationThread[CharacterRange["A", "H"] -> Partition[countries, 4]]
2. Simulation of a match
This is probably the hardest part of this problem. How to predict the outcome of a match? If it were easy, we would not even play! Well, I will use the same prediction used by other sources (like this paper), which is based on a Poisson distribution using the ration between the FIFA rankings. I'm adding also another factor that could be used to tweak more the probability (for example, Russia may not have a good ranking, but it is playing at home, that may be important!).
When it is not allowed to be a draw, instead of doing only an extra time and round of penalties if needed, I just called again the basic results to get a new result until no the tie is broken. To get an actual result we may want to call only once the Poisson distribution (for the extra time), and then maybe a binomial distribution for penalties.
getPossibleResult[weight1_, weight2_, lambda1_, lambda2_] :=
    {RandomVariate[PoissonDistribution[lambda1 weight1/weight2]], RandomVariate[PoissonDistribution[lambda2 weight2/weight1]]};

simulateMatch[weight1_, weight2_, lambda1_, lambda2_, drawQ_] := Module[{result},
    result = getPossibleResult[weight1, weight2, lambda1, lambda2];
    If[!drawQ,
        While[SameQ @@ result,
            result = getPossibleResult[weight1, weight2, lambda1, lambda2]
        ];
    ];
    result
];

simulatedMatchResults[match["Groups"][team1_, team2_]] := simulateMatch[team1 /. rankingPoints, team2 /. rankingPoints, 1, 1, True];
simulatedMatchResults[match["Knockout"][team1_, team2_]] := simulateMatch[team1 /. rankingPoints, team2 /. rankingPoints, 1, 1, False];
In this first model I'm using 1 for the lambda values, but we could generate another dispatch list to modify for example Russia factor for playing as local, or adding more strengh to our favorite team, etc. Of course, if you change too much the values, remember not to use the result for doing any bet!
3. Simulation of the groups phase
To simulate a each group, we will play each match, and then we will compute the full table of results sorted by points, goals difference, goals done, and goals against.
simulateGroup[groupsTeam_] :=
Module[{matches = DeleteDuplicatesBy[Permutations[groupsTeam, {2}], Sort], matchResults, resultsTable, resultsLookup},
    resultsLookup[_, _] = 0;
    matchResults = {##, simulatedMatchResults[match["Groups"][##]]} & @@@ matches;
    Function[{team1, team2, result},
        Switch[result,
            {a_, b_} /; a > b,
                resultsLookup[team1, "WINS"] = resultsLookup[team1, "WINS"] + 1;
                resultsLookup[team2, "LOSTS"] = resultsLookup[team2, "LOSTS"] + 1;
                resultsLookup[team1, "POINTS"] = resultsLookup[team1, "POINTS"] + 3;
            ,
            {a_, b_} /; a < b,
                resultsLookup[team2, "WINS"] = resultsLookup[team2, "WINS"] + 1;
                resultsLookup[team1, "LOSTS"] = resultsLookup[team1, "LOSTS"] + 1;
                resultsLookup[team2, "POINTS"] = resultsLookup[team2, "POINTS"] + 3;
            ,
            _
            ,
                resultsLookup[team1, "DRAWS"] = resultsLookup[team1, "DRAWS"] + 1;
                resultsLookup[team2, "DRAWS"] = resultsLookup[team2, "DRAWS"] + 1;
                resultsLookup[team1, "POINTS"] = resultsLookup[team1, "POINTS"] + 1;
                resultsLookup[team2, "POINTS"] =  resultsLookup[team2, "POINTS"] + 1;
        ];
        resultsLookup[team1, "GOL+"] = resultsLookup[team1, "GOL+"] + result[[1]];
        resultsLookup[team2, "GOL+"] = resultsLookup[team2, "GOL+"] + result[[2]];
        resultsLookup[team1, "GOL-"] = resultsLookup[team1, "GOL-"] + result[[2]];
        resultsLookup[team2, "GOL-"] = resultsLookup[team2, "GOL-"] + result[[1]];
    ] @@@ matchResults;
    resultsTable = Table[
        {
            t,
            resultsLookup[t, "POINTS"],
            resultsLookup[t, "WINS"],
            resultsLookup[t, "LOSTS"],
            resultsLookup[t, "DRAWS"],
            resultsLookup[t, "GOL+"],
            resultsLookup[t, "GOL-"],
            resultsLookup[t, "GOL+"] - resultsLookup[t, "GOL-"]
        }, {t, groupsTeam}];
    SortBy[resultsTable, {-#[[2]], -#[[-1]], -#[[-3]], #[[-2]]} &]
];

selectClassified[groupResultTable_] := groupResultTable[[;;2, 1]];

simulateAllGroups[groups_] := simulateGroup /@ groups;

selectAllClassified[groupsResults_] := AssociationMap[List["1"<>#[[1]]->#[[2, 1]],"2"<>#[[1]]->#[[2, 2]]] &, selectClassified /@ groupsResults]
4. Simulation of the second phase
4.1. Matches schedule
First step here is to get the match schedule. Who plays against who in each knockout round? Well, that's easy to get from FIFA, and as a way to store it, I will do a list of rules of matchnumber -> {team1, team2}, where team1 and team2 will be strings with the form "1"|"2" ~~ group or "W"|"L" ~~ matchnumber.
roundOf16 = Thread[Range[49, 56] -> {{"1C", "2D"}, {"1A", "2B"}, {"1B", "2A"}, {"1D", "2C"}, {"1E", "2F"}, {"1G", "2H"}, {"1F", "2E"}, {"1H", "2G"}}];

quarters = Thread[Range[57, 60] -> {{"W49", "W50"}, {"W53", "W54"}, {"W55", "W56"}, {"W51", "W52"}}];

semifinals = {61 -> {"W57", "W58"}, 62 -> {"W59", "W60"}};

thirdplace = {63 -> {"L61", "L62"}};

final = {64 -> {"W61", "W62"}}
With all this we could define the competition as a succesive group of rounds:
competition = {roundOf16, quarters, semifinals, Join[thirdplace, final]};
4.2. Playing the phase
Playing a round means doing a match and returning the results, to make it easier, the results will accumulate, so that we can then use Fold to have the total results.
playRound[round_, previousWL_] := Join[
    previousWL,
    Association@Flatten@Map[
        Thread[
            {"L" <> ToString[#[[1]]], "W" <> ToString[#[[1]]]} ->
            #[[2]][[Ordering[simulatedMatchResults[match["Knockout"] @@ #[[2]]]]]]
        ] &,
        round /. previousWL
    ]
];

playRounds[groupsResults_] := Fold[playRound[#2, #1] &, groupsResults, competition]
4.3. First basic stats
With all the results, the first stats I could think about were in which position each team finished. I only cared about the teams that actually reached at least the second phase. Of course if we run this enough times, all the teams will get into the second phase at least once... I guess.
First, let's define a function that will return the team position depending on the match they lost (or won, for third and first place):
posByLost = Flatten[Thread /@ {
    ("L" <> ToString[#] & /@ roundOf16[[All, 1]]) -> 9,
    ("L" <> ToString[#] & /@ quarters[[All, 1]]) -> 5,
    "L63" -> 4, "W63" -> 3, "L64" -> 2, "W64" -> 1, _ -> None
}]

(posByLostFun[#1] = #2) & @@@ posByLost;
If we apply that function to the result of playRounds we can get which position each team got:
getPosition[globalResults_] := Reverse[Sort[DeleteCases[KeyValueMap[posByLostFun[#1] -> #2 &, globalResults], None -> _]], {2}]
And if we have multiple resutls of getPosition we would need to do a summary:
summaryPositions[positions_] := SortBy[
    With[{n = Length[positions]},
        GroupBy[Join @@ positions, First -> Last, Sort[(#1 -> N[#2/n] & @@@ Tally[#])] &]
    ],
    -Accumulate[Lookup[#, {1, 2, 3, 4, 5, 9}, 0]] &
];
But, given that it is more common to talk about the winner, finalist, semifinalist, etc, let's make a function to compute that exactly, using as input the previous result:
accumulatePositions[pos_] := Association@
    ReleaseHold[
        {
            "Winner" -> Hold[1],
            "Finalist" -> Hold[1] + Hold[2],
            "Semifinalist" -> Hold[1] + Hold[2] + Hold[3] + Hold[4],
            "Quarters" -> Hold[1] + Hold[2] + Hold[3] + Hold[4] + Hold[5],
            "Round16" -> Hold[1] + Hold[2] + Hold[3] + Hold[4] + Hold[5] + Hold[9]
        } /. Append[pos, _Integer -> 0]
    ];
4.4. Other ideas for more stats
Some very custom stats could be done too, like for example, getting the most probably final, or the against which teams will play your favorite team.
5. All together
Now we have all the tools needed to run the world cup n times:
simulateWC[n_] := accumulatedPositions[
    summaryPositions[
        Table[
            getPosition[
                playRounds[
                    selectAllClassified[
                        simulateAllGroups[
                            teamsByGroup
                        ]
                    ]
                ]
            ],
            n
        ]
    ]
];
And we need to have a nice display of it:
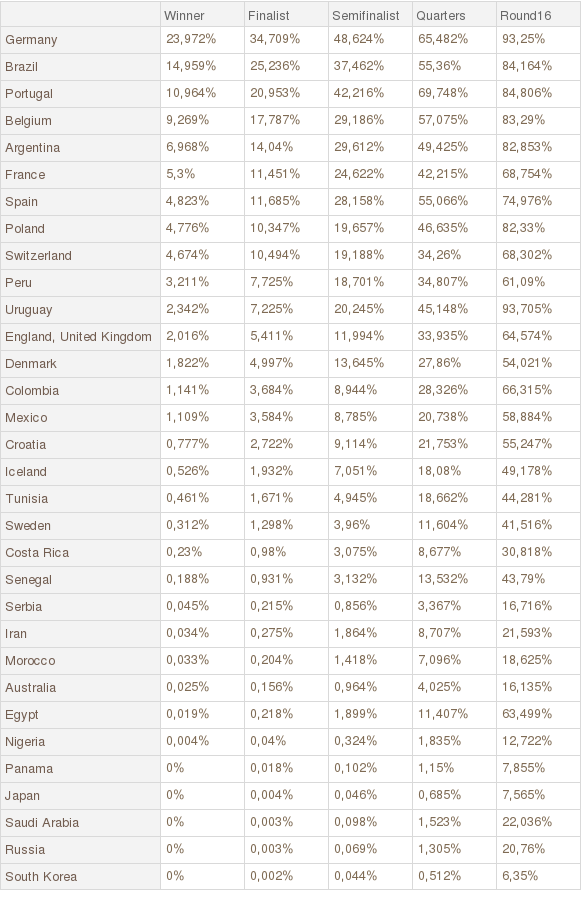
displaySimulationResult[sr_] := (Dataset`$DatasetTargetRowCount = 40; Dataset[sr /. x_?NumericQ :> Quantity[100 x, "Percent"]])
(I know, and I always say it, Dataset is for much more than just displaying tables, but they look great).
5.1. Using it!
Now we can play with our functions, and do simulations of 10000 or 100000 or even more if you have memory and time, and get the probabilities by just counting.
Some results:
simulation100k = simulateWC[100000];
(This took 473 seconds in my computer, i7-4710HQ ).
And now we can display them:
displaySimulationResult[simulation100k]
5.1.1. Why not a map too?
Let's make a nice map of the winners probability and about reaching the second phase:
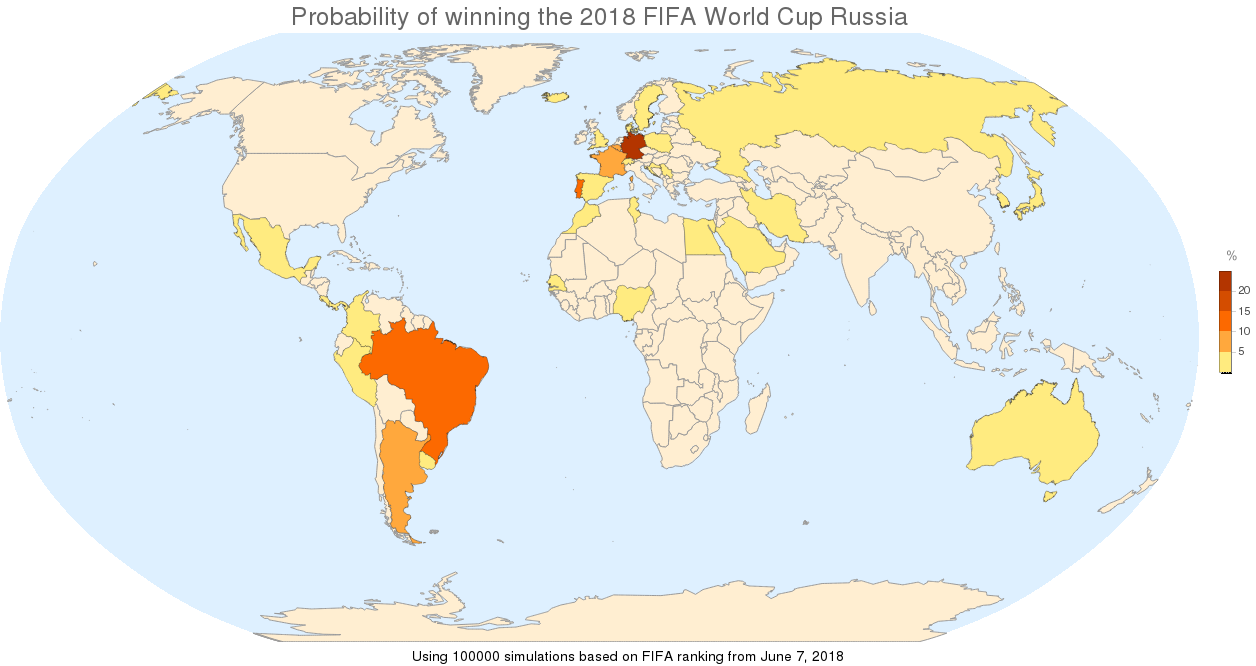
Labeled[GeoRegionValuePlot[Quantity[100 #["Winner"], "Percent"] & /@ simulation100k,
    GeoBackground -> "CountryBorders", GeoProjection -> "Robinson", ImageSize -> 1200,
    PlotLabel -> Style["Probability of winning the 2018 FIFA World Cup Russia", 24]],
    Text["Using 100000 simulations based on FIFA ranking from June 7, 2018"]
]
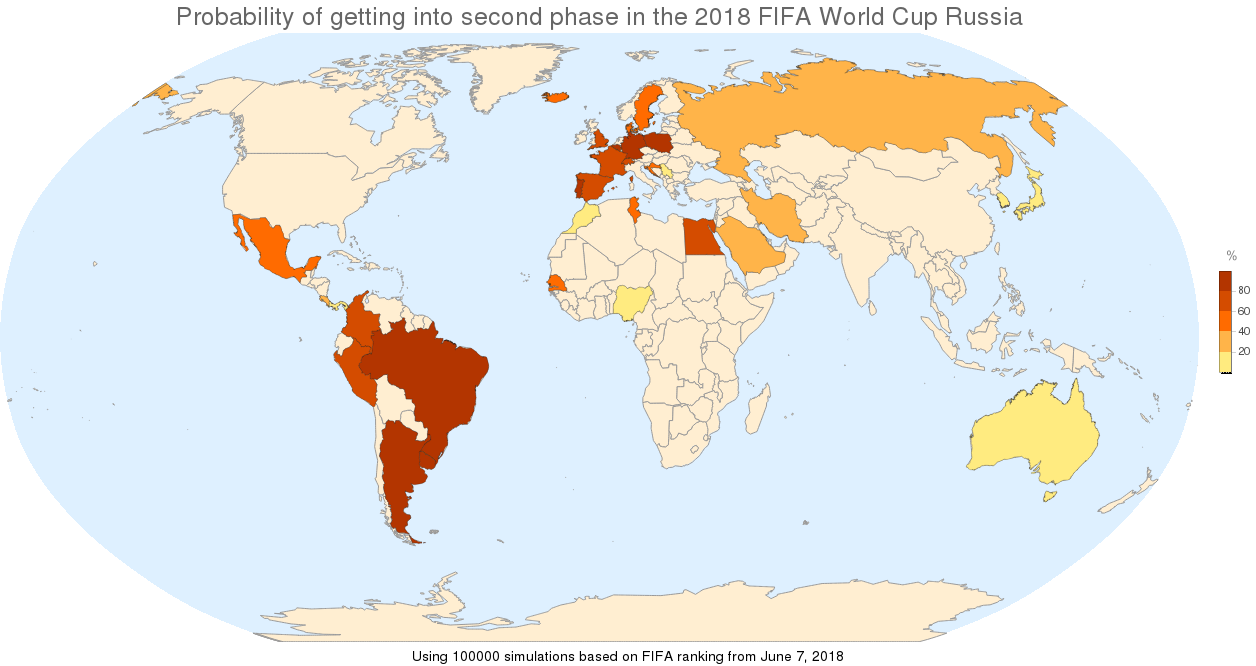
Labeled[GeoRegionValuePlot[Quantity[100 #["Round16"], "Percent"] & /@ simulation100k,
    GeoBackground -> "CountryBorders", GeoProjection -> "Robinson", ImageSize -> 1200,
    PlotLabel -> Style["Probability of getting into second phase in the 2018 FIFA World Cup Russia", 24]],
    Text["Using 100000 simulations based on FIFA ranking from June 7, 2018"]
]
5.2. Desired final!
What about computing the probability of your desired final? It shouldn't be that hard given all this, it would be a matter of getting the joint probability of your teams being in first or second position simultaneously. Let's say we want a Peru-Brazil final -- and of course, expecting that Peru wins :).
We could try simply 10000 times this time:
Block[{n = 10000, c = 0},
    Do[
        c += Boole[MatchQ[Sort[{"W64", "L64"} /. playRounds[selectAllClassified[simulateAllGroups[teamsByGroup]]]], {Entity["Country", "Brazil"], Entity["Country", "Peru"]}]];
        , n
    ];
    Quantity[100.0 c/n, "Percent"]
]
And after doing that I got 0.85%, not as good as we would like.
Conclusions
- This is going to be fun!
- This simulation is based on a given ranking, but it is easy to change it, according to different expectations and factors.
- As a pending task remains the addition of a meaningful extra factor for each team (or even eath team pair).
 Attachments:


