Hi,
this is far from perfect for a million reasons (and is for road isochrones). I have more efficient code for this, but cannot find it right now.
Let's do this for Aberdeen. Here are the bounds:
bound = {GeoPosition[{57.180933336035885`, -2.033641228304261}, "ITRF00"], GeoPosition[{57.08609085736762, -2.187063761724743}, "ITRF00"]}
Next we make a grid from where we use the travel times to generate the isochrones (here a 20 by 20 grid):
M = 20.;
grid =
 Flatten[Table[GeoPosition[{x, y}],
   Evaluate[
    Append[Prepend[Reverse@bound[[All, 1, 1]], x],
     Abs[Differences[bound[[All, 1, 1]]]/M][[1]]]],
   Evaluate[
    Append[Prepend[Reverse@bound[[All, 1, 2]], y],
     Abs[Differences[bound[[All, 1, 2]]]/M][[1]]]]]];
The following code computes travelling times. It gives error messages because it does not find travel paths for each location.
travellingtimes = # ->
     QuantityMagnitude[
      UnitConvert[
       TravelTime[
        GeoPosition[
         Entity["City", {"Aberdeen", "AberdeenCity",
            "UnitedKingdom"}]["Coordinates"]], #], "Seconds"]] & /@ grid;
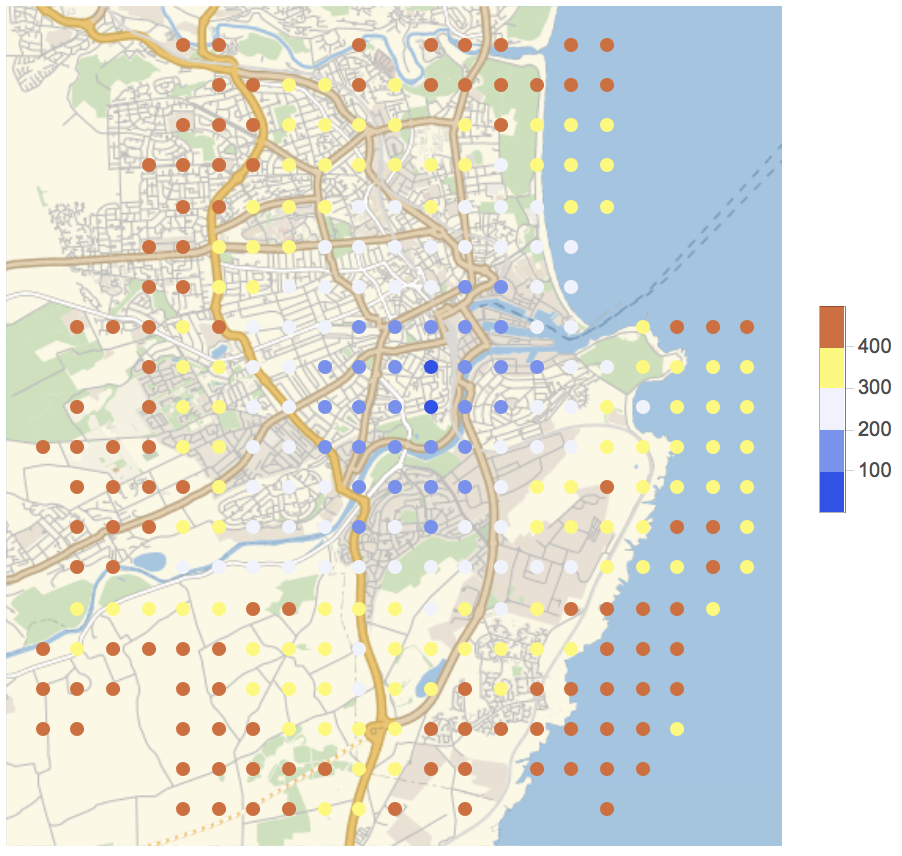
Let's plot this:
GeoRegionValuePlot[
 Select[travellingtimes, NumberQ[#[[2]]] && #[[2]] < 500 &],
 ColorFunction -> "TemperatureMap"]
We can then also compute a ContourPlot of this and overlay it (crudely) to the map:
cplot = ListContourPlot[
  Flatten[{Reverse@#[[1, 1]], Min[#[[2]], 500]}] & /@ travellingtimes,
   InterpolationOrder -> 4, Contours -> 80, ContourStyle -> None,
  ColorFunction -> "TemperatureMap", Frame -> None,
  ImagePadding -> None, PlotRangeClipping -> None,
  PlotRangePadding -> None, ImageSize -> Full];

ImageCompose[
 GeoGraphics[
  Polygon[Transpose[
    Reverse@{{57.08609085736762`,
       57.180933336035885`}, {-2.187063761724743`, -2.033641228304261`}}]], ImageSize -> Full,
  AspectRatio -> 1.], {cplot, 0.5}]
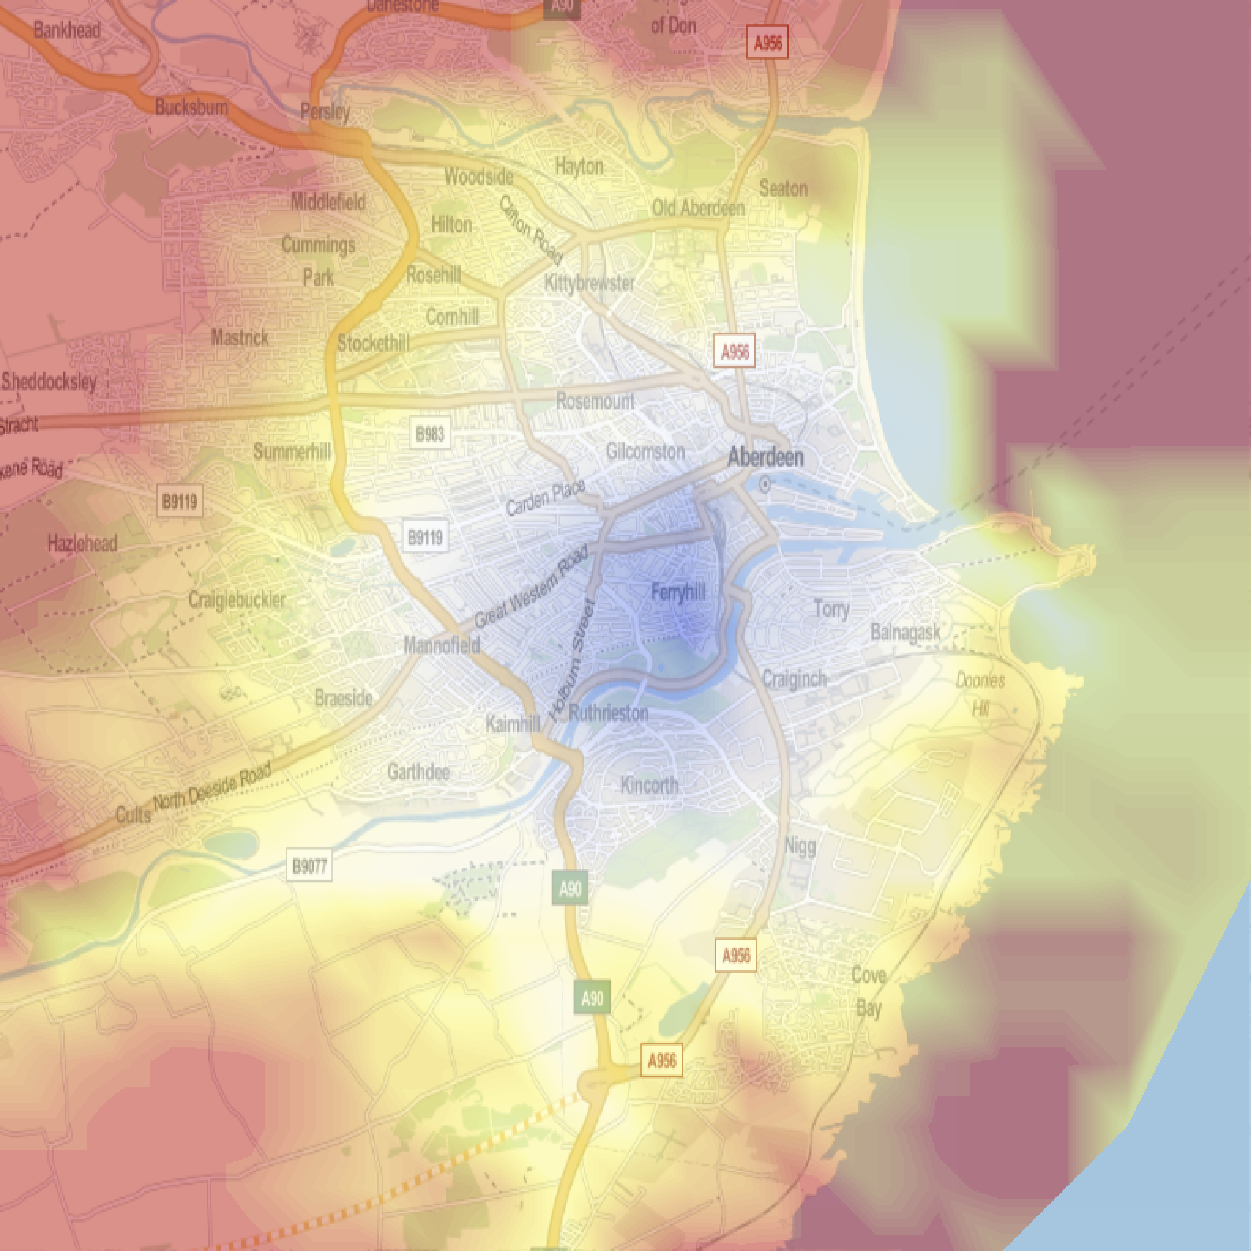
There are quite some problems here, e.g. over the water. I had two students who used a far superior way of calculating isochrones to optimise the ambulance service in Chicago and another group who used it for advanced geoprofiling taking the escape routes of criminals into consideration.
Cheers,
Marco
PS: This particular code is very inefficient. On can use TravelDirections in a much more efficient way, e.g. using the entire trajectories with all the time stars that are part of the dataset. I just wanted to show the principle, but could post something similar, but more efficient. I also think that the more detailed information might give a way to produce transit times, if for example the waiting times and transition points are known.
If data on the transit network is given we might also just use MMA's graph theory tools, I guess. It would indeed be useful to have example data here.
PPS: I don't think that there are bus time table yet, i.e. travel directions would use waiting times for busses etc. There are however, "driving", "walking", "biking" as methods.


