Message Boards Message Boards

Reading Specific Dimensions of a Multidimensional Time Series?

Posted 6 years ago

I'm processing natural language signals. One of the more useful stats is obtained with this function:

formants = AudioLocalMeasurements[sample, "Formants"];

It creates a time series object that has a 5-dimensional output. In other words, if I plotted the data in the time series, I'd get five plots, as shown below. enter image description here

However, I'd like to get rid of some of the data and keep only the first two or three formants (lower two or three lines). I've tried to adjust the parameters of the ListLinePlot function and also to alter the data itself with replacement rules, both with no success.

If anyone knows how I can either reduce the data in the time series or display only part of the data, I would appreciate the help.

Thanks in advance,

Mark

POSTED BY: Mark Greenberg
8 Replies

Mark,

You really should not take "parts" or do mapping of TemporalData as suggested above -- TemporalData is a very nice structure that is meant for this type of manipulation directly.

Let's create an example:

In[34]:= s1 = {2, 1, 6, 5, 7, 4};
s2 = {4, 7, 5, 6, 1, 2};
s3 = {4, 7, 5, 6, 1, 2} + 2;
s4 = {4, 7, 5, 6, 1, 2} + 3;
t = {1, 2, 5, 10, 12, 15};

In[35]:= td = TemporalData[{s1, s2, s3, s4}, {t}]

TemporalData is manipulated with its Properties. You can get the available properties using this:

In[36]:= td["Properties"]

Out[36]= {"Components", "DateList", "DatePath", "DatePaths", \
"Dates", "FirstDates", "FirstTimes", "FirstValues", "LastDates", \
"LastTimes", "LastValues", "Part", "Path", "PathCount", \
"PathFunction", "PathFunctions", "PathLength", "PathLengths", \
"Paths", "PathTimes", "SliceData", "SliceDistribution", "TimeList", \
"Times", "ValueDimensions", "ValueList", "Values"}

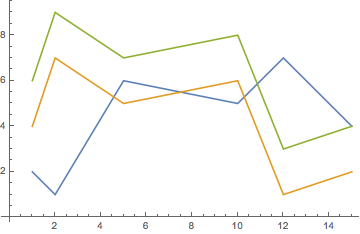
You can plot any portion of the TemporalData using the "Components" property: (below I grab the first 3 paths)

In[37]:= ListLinePlot[td["Components"][[1 ;; 3]]]

enter image description here

To get the raw data you can get the "Paths" or just the "Values" or the ValueList" or the "Times" or the "TimeList", etc -- experiment and you will see the various formats you can obtain. The Normal[] function that Henrik showed you will give the same result as "Paths" for TemporalData. The Normal function will behave differently depending on what you pass to it. It tends to give you the most common format that people generally want for the respective input -- with TemporalData that happens to be "Paths". In this case:

In[38]:= td["Paths"]

Out[38]= {{{1, 2}, {2, 1}, {5, 6}, {10, 5}, {12, 7}, {15, 4}}, {{1, 
   4}, {2, 7}, {5, 5}, {10, 6}, {12, 1}, {15, 2}}, {{1, 6}, {2, 
   9}, {5, 7}, {10, 8}, {12, 3}, {15, 4}}, {{1, 7}, {2, 10}, {5, 
   8}, {10, 9}, {12, 4}, {15, 5}}}

In[39]:= Normal[td]

Out[39]= {{{1, 2}, {2, 1}, {5, 6}, {10, 5}, {12, 7}, {15, 4}}, {{1, 
   4}, {2, 7}, {5, 5}, {10, 6}, {12, 1}, {15, 2}}, {{1, 6}, {2, 
   9}, {5, 7}, {10, 8}, {12, 3}, {15, 4}}, {{1, 7}, {2, 10}, {5, 
   8}, {10, 9}, {12, 4}, {15, 5}}}

Its a mistake to try to parse inside of the TemporalData structure because it is incredibly useful for Plotting, shifting data, manipulating and transforming data, etc. You should review the documentation of TimeSeries for more information.

Regards,

Neil

POSTED BY: Neil Singer

Hi Mark,

your formants variable is holding TemporalData. So here is one way: With Normal you can convert this into "normal data", which easily can be modified. Then you convert the result back into TemporalData:

data = {#1, #2[[1 ;; 3]]} & @@@ Normal[formants];
ListLinePlot[TemporalData[data]]

Regards -- Henrik

POSTED BY: Henrik Schachner

Mark, i have no idea what the structure of formants is. 5-dimensional output? Can you write down a sample structure? So you want to get full control over the green, the yellow, and the blue line? Common list ops are Take[ ], Part[ ], Extract[ ], Span[ ], All[ ]. Or Select[ ], Pick[ ], Cases[ ].

POSTED BY: Raspi Rascal
Posted 6 years ago

Thank you, Henrik. That's exactly what I need. I've been using the Wolfram language for two years now and never heard of the Normal function. Good to know. : )

Mark

POSTED BY: Mark Greenberg
Posted 6 years ago

Mark,

It looks like formants is a fairly complex structure. It can be modified, however. It looks like two parts need to be changed.

fmnts = ReplacePart[
  formants, {2, 1, 1} -> Map[Take[#, -3] &, formants[[2, 1, 1]]]]

would reduce the data to the last 3 paths, but the ValueDimensions option in

formants[[2, 7]]

must be altered as well.

POSTED BY: Updating Name
Posted 6 years ago

Excellent reply, Neil! So clear and to the point. I think that I study the docs carefully, but I see that I missed the significance of the properties in the docs for TimeSeries. It looks like ["Values"] will likely suit my purposes. Thank you for taking the time to explain how to use TimeSeries.

Mark

POSTED BY: Mark Greenberg

Mark,

Glad to help. The docs are a bit daunting at times...

The more one thing I really like about TimeSeries data is that you can window and shift it. It makes plotting and adjusting data really easy. Make sure to look at TimeSeriesWindow and TimeSeriesShift. I use these functions to align data in time -- for example if we have a trigger that varies from one data set to another we can shift the waveforms to align the triggers while keeping the data in a TimeSeries and you do not need to figure out how to process the raw data.

Regards,

Neil

POSTED BY: Neil Singer

Perfect! Many thanks from my side as well!

Regards -- Henrik

POSTED BY: Henrik Schachner
Reply to this discussion
Community posts can be styled and formatted using the Markdown syntax.
Reply Preview
Attachments
Remove
or Discard

Group Abstract Group Abstract