Message Boards Message Boards

1
|
6938 Views
|
6 Replies
|
3 Total Likes
View groups...
Share
Share this post:

Place a ContourPlot under a Plot3D?

Posted 6 years ago

I would like to combine a 3-dimensional graph of a function with its 2-dimensional contour-plot underneath it in a professional way. But I have no idea how to start, I try this:

W[s_, b_, q_, 
  p_] := (1/\[Pi]) Exp[-(p^2) + 
    I*Sqrt[2] p (b - Conjugate[s]) - (1/
       2)*((Abs[s])^2 + (Abs[b])^2) - (q^2) + 
    Sqrt[2]*q*(b + Conjugate[s]) - (Conjugate[s]*b)]

Wpsi[\[Alpha]_, q1_, p1_, q2_, p2_] := 
 Np[\[Alpha]]^2 (W[\[Alpha], \[Alpha], q1, p1]*
     W[\[Alpha], \[Alpha], q2, p2] + 
    W[\[Alpha], -\[Alpha], q1, p1]*W[\[Alpha], -\[Alpha], q2, p2] + 
    W[-\[Alpha], \[Alpha], q1, p1]*W[-\[Alpha], \[Alpha], q2, p2] + 
    W[-\[Alpha], -\[Alpha], q1, p1]*W[-\[Alpha], -\[Alpha], q2, p2])

plot3D = Plot3D[Wpsi[1, 0, p1, 0, p2], {p2, -2, 2}, {p1, -2, 2}, 
   PlotTheme -> "Scientific", PlotPoints -> 60, PlotRange -> All, 
   ColorFunction -> Hue, PlotLegends -> Automatic, Mesh -> None];
cntplot = 
  ContourPlot[Wpsi[1, 0, p1, 0, p2], {p2, -2, 2}, {p1, -2, 2}, 
   PlotRange -> All, Contours -> 20, Axes -> False, PlotPoints -> 30, 
   PlotRangePadding -> 0, Frame -> False, ColorFunction -> Hue];
gr = Graphics3D[{Texture[cntplot], EdgeForm[], 
    Polygon[{{-2, -2, -0.4}, {2, -2, -0.4}, {2, 2, -0.4}, {-2, 
       2, -0.4}}, 
     VertexTextureCoordinates -> {{0, 0}, {1, 0}, {1, 1}, {0, 1}}]}, 
   Lighting -> "Naturel"];

Show[plot3D, gr, PlotRange -> All, BoxRatios -> {1, 1, .6}, 
 FaceGrids -> {Back, Left}]

that gives: graph it is not good for me, I want some think like this: needs
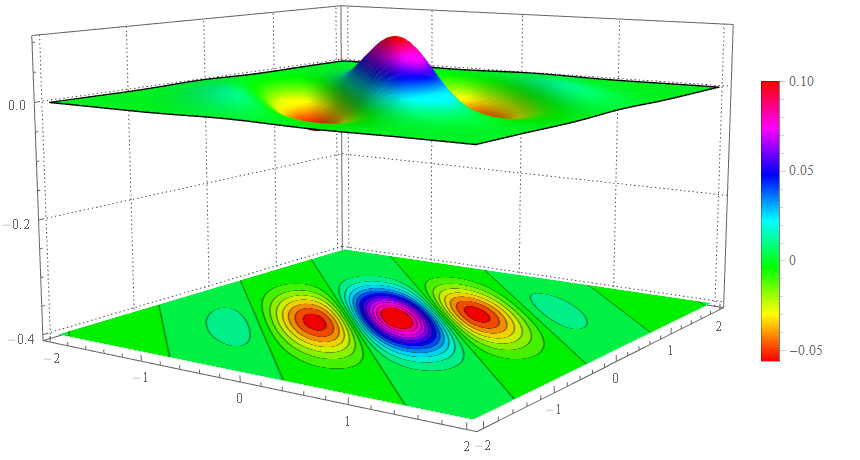
Are i can do it by mathematica ?

POSTED BY: Ziane Mustapha
6 Replies

Please see relevant discussion: "Placing a ContourPlot under a Plot3D "

http://community.wolfram.com/groups/-/m/t/1148582

POSTED BY: Moderation Team

Thank you, this very interesting design is being discussed on http://community.wolfram.com/groups/-/m/t/1148582 As I understand it, we are discussing not just "Placing a ContourPlot under a Plot3D ", but a special design that the author of the topic suggested. And then how this design is implemented in Mathematica codes. In the discussion on http://community.wolfram.com/groups/-/m/t/1148582 there is nothing about it.

There's SliceContourPlot3D. Just set the slice to be the bottom plane (too bad Bottom does not work automatically since this is a common application!):

ClearAll[myplot];
SetAttributes[myplot, HoldAll];
myplot[f_, x_List, y_List, z : {zsym_, z1_, z2_}, opts___?OptionQ] :=
 Show[
   SliceContourPlot3D[f, zsym == z1, x, y, z, Evaluate@FilterRules[{opts}, Options@SliceContourPlot3D]],
   Plot3D[f, x, y, Evaluate@FilterRules[{opts}, Options@Plot3D], PlotRange -> {z1, z2}]
   ];

myplot[Cos[2 (x + y)]/(2 + x^4 - x y + y^4), {x, -2, 2}, {y, -2, 2}, {z, -2, 1}, ColorFunction -> Hue]

enter image description here

POSTED BY: Michael Rogers

A small variation on Alexander's solution:

gr2[x_] := 
 Graphics3D[
  Cases[cntplot[x], 
   GraphicsComplex[pts_, others___] :> 
    GraphicsComplex[Map[Append[-1], pts], others], All]]

This way the contour plot does not get rasterized. You can see the difference by enlarging:

With[{r = .1},
 {Show[gr[1], 
   PlotRange -> {r + r {-1, 1}, r + r {-1, 1}, -1 + r {-1, 1}}],
  Show[gr2[1], 
   PlotRange -> {r + r {-1, 1}, r + r {-1, 1}, -1 + r {-1, 1}}]}]
POSTED BY: Gianluca Gorni

The function Np[\[Alpha]]^2 is not defined . I put Np[\[Alpha]]^2=1. We can use this code

W[s_, b_, q_, 
  p_] := (1/\[Pi]) Exp[-(p^2) + 
    I*Sqrt[2] p (b - Conjugate[s]) - (1/
       2)*((Abs[s])^2 + (Abs[b])^2) - (q^2) + 
    Sqrt[2]*q*(b + Conjugate[s]) - (Conjugate[s]*b)]

Wpsi[\[Alpha]_, q1_, p1_, q2_, 
  p2_] := (W[\[Alpha], \[Alpha], q1, p1]*
    W[\[Alpha], \[Alpha], q2, p2] + 
   W[\[Alpha], -\[Alpha], q1, p1]*W[\[Alpha], -\[Alpha], q2, p2] + 
   W[-\[Alpha], \[Alpha], q1, p1]*W[-\[Alpha], \[Alpha], q2, p2] + 
   W[-\[Alpha], -\[Alpha], q1, p1]*W[-\[Alpha], -\[Alpha], q2, p2])

plot3D[x_] := 
  Plot3D[Wpsi[x, 0, p1, 0, p2], {p2, -2, 2}, {p1, -2, 2}, 
   PlotPoints -> 60, PlotRange -> All, ColorFunction -> Automatic, 
   Mesh -> None, Axes -> False, Boxed -> False];
cntplot[x_] := 
  ContourPlot[Wpsi[x, 0, p1, 0, p2], {p2, -2, 2}, {p1, -2, 2}, 
   PlotRange -> All, Contours -> 20, Axes -> False, PlotPoints -> 30, 
   PlotRangePadding -> 0, Frame -> False, ColorFunction -> Automatic];
gr[x_] := 
  Graphics3D[{Texture[cntplot[x]], EdgeForm[], 
    Polygon[{{-2, -2, -1}, {2, -2, -1}, {2, 2, -1}, {-2, 2, -1}}, 
     VertexTextureCoordinates -> {{0, 0}, {1, 0}, {1, 1}, {0, 1}}]}, 
   Lighting -> "Naturel", Boxed -> False];
s[x_] := Show[plot3D[x], gr[x], ViewPoint -> {2, -2, 1}, 
  Boxed -> False, BoxRatios -> {1, 1, 1}]
Table[s[x], {x, .5, 2, .5}]

fig1

Function not defined Np[\[Alpha]]^2

Reply to this discussion
Community posts can be styled and formatted using the Markdown syntax.
Reply Preview
Attachments
Remove
or Discard

Group Abstract Group Abstract