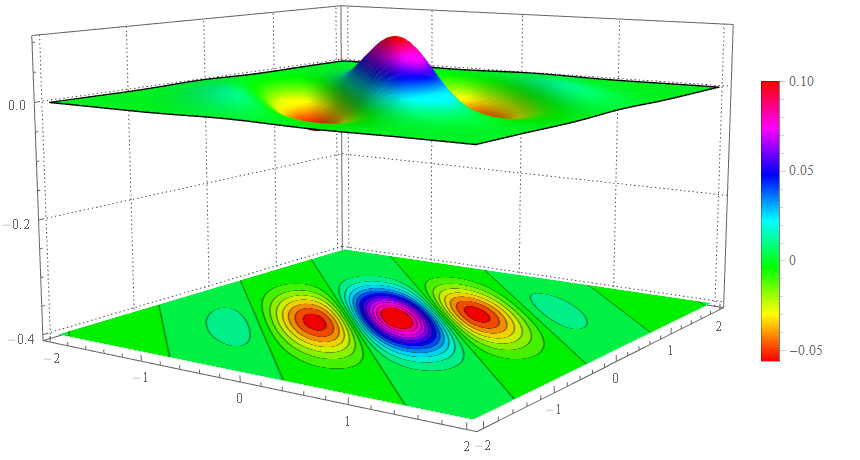
I would like to combine a 3-dimensional graph of a function with its 2-dimensional contour-plot underneath it in a professional way. But I have no idea how to start, I try this:
W[s_, b_, q_,
  p_] := (1/\[Pi]) Exp[-(p^2) +
    I*Sqrt[2] p (b - Conjugate[s]) - (1/
       2)*((Abs[s])^2 + (Abs[b])^2) - (q^2) +
    Sqrt[2]*q*(b + Conjugate[s]) - (Conjugate[s]*b)]

Wpsi[\[Alpha]_, q1_, p1_, q2_, p2_] :=
 Np[\[Alpha]]^2 (W[\[Alpha], \[Alpha], q1, p1]*
     W[\[Alpha], \[Alpha], q2, p2] +
    W[\[Alpha], -\[Alpha], q1, p1]*W[\[Alpha], -\[Alpha], q2, p2] +
    W[-\[Alpha], \[Alpha], q1, p1]*W[-\[Alpha], \[Alpha], q2, p2] +
    W[-\[Alpha], -\[Alpha], q1, p1]*W[-\[Alpha], -\[Alpha], q2, p2])

plot3D = Plot3D[Wpsi[1, 0, p1, 0, p2], {p2, -2, 2}, {p1, -2, 2},
   PlotTheme -> "Scientific", PlotPoints -> 60, PlotRange -> All,
   ColorFunction -> Hue, PlotLegends -> Automatic, Mesh -> None];
cntplot =
  ContourPlot[Wpsi[1, 0, p1, 0, p2], {p2, -2, 2}, {p1, -2, 2},
   PlotRange -> All, Contours -> 20, Axes -> False, PlotPoints -> 30,
   PlotRangePadding -> 0, Frame -> False, ColorFunction -> Hue];
gr = Graphics3D[{Texture[cntplot], EdgeForm[],
    Polygon[{{-2, -2, -0.4}, {2, -2, -0.4}, {2, 2, -0.4}, {-2,
       2, -0.4}},
     VertexTextureCoordinates -> {{0, 0}, {1, 0}, {1, 1}, {0, 1}}]},
   Lighting -> "Naturel"];

Show[plot3D, gr, PlotRange -> All, BoxRatios -> {1, 1, .6},
 FaceGrids -> {Back, Left}]
that gives:  it is not good for me, I want some think like this:
Are i can do it by mathematica ?