Message Boards Message Boards

13
|
20885 Views
|
6 Replies
|
26 Total Likes
View groups...
Share
Share this post:

Blending color gradients to expand color schemes available for plotting

Posted 11 years ago
When plotting analytic expressions with such functions like Plot3D, ContourPlot, etc. we most commonly use color gradients to beautify the graphs. Here are examples for "SouthwestColors" and "Rainbow" gradient color schemes:
{ReliefPlot[Table[RandomReal[] (Sin[x + y^2] + Sin[x^2 + 3 y]), {x, -3, 3, .01}, {y, -3, 3, .01}],
  ColorFunction -> ColorData["SouthwestColors"]],

ReliefPlot[Table[Evaluate[Sum[Sin[RandomReal[4, 2].{x, y}], {5}]], {x, 0, 10, .05}, {y, 0, 10, .05}],
  ColorFunction -> ColorData["Rainbow"]]}
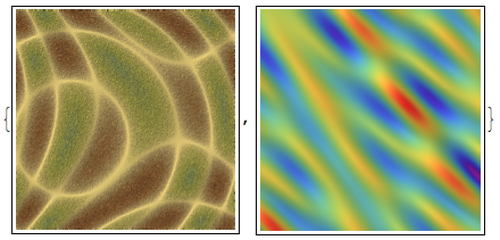


There are 51 built in gradients in Mathemtica.
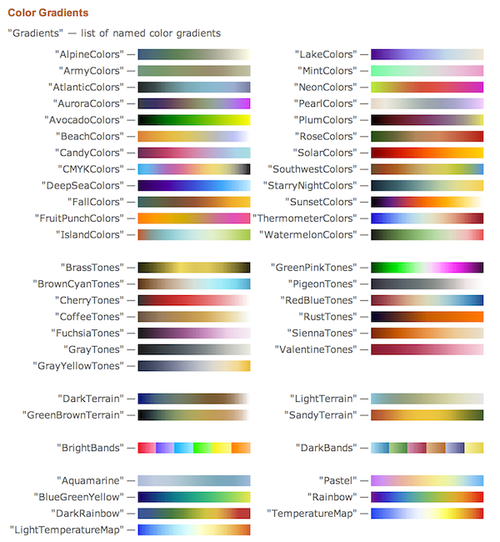


We could have at least 51^2 if we would learn how to blend them. Define a blending function 
mixer[grad1_, grad2_][m_, x_] := Blend[{ColorData[grad1][x], ColorData[grad2][x]}, m]

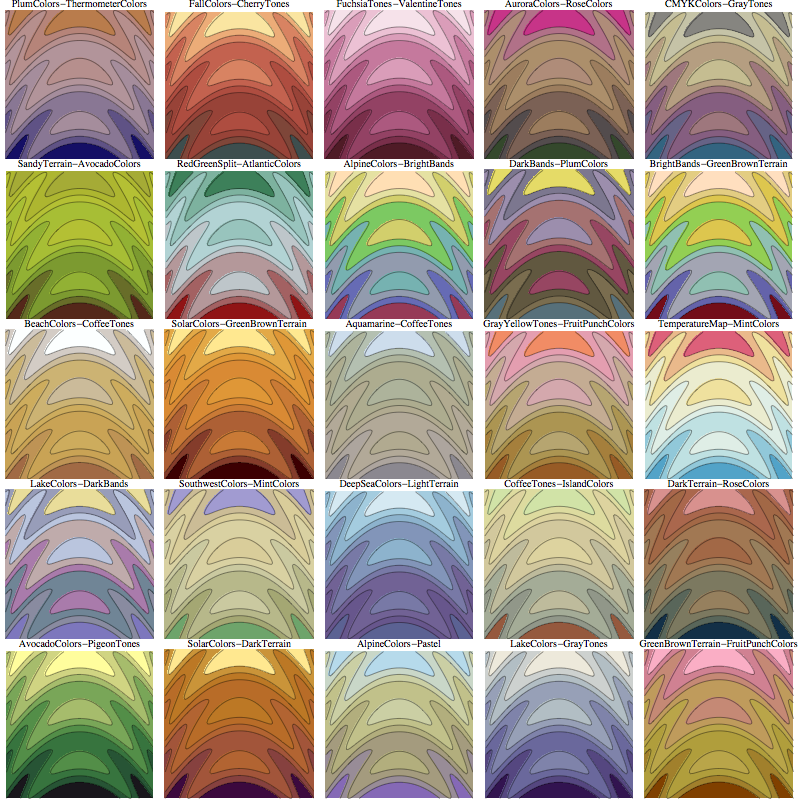
where m is the blending ratio. Now we can mix randomly color gradients at 0.5 even blending ratio to see what kind of colors palettes we get:
g[grad1_, grad2_] := ContourPlot[y + Sin[x^2 + 3 y], {x, -3, 3}, {y, -3, 3},
  ColorFunction -> (mixer[grad1, grad2][.5, #] &), Frame -> False,
  PlotRangePadding -> 0, PlotLabel -> Style[grad1 <> "-" <> grad2, 10]]

GraphicsGrid[Partition[ParallelTable[g[RandomChoice[ColorData["Gradients"]],
RandomChoice[ColorData["Gradients"]]], {25}], 5], Spacings -> 0, ImageSize -> 800]


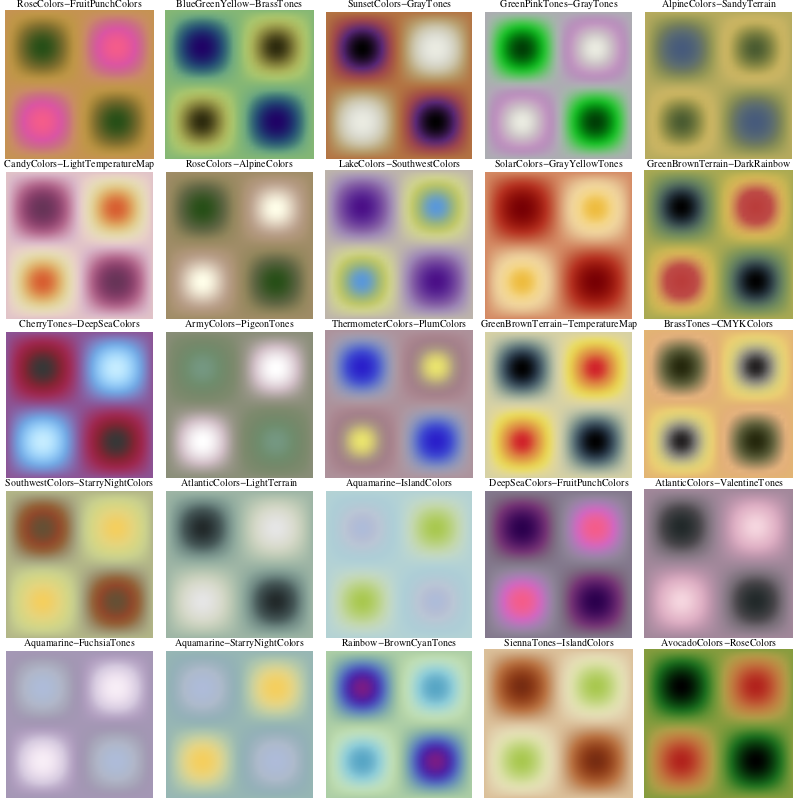
We could also blend at a changing ration, so that at min we have one color gradient and at max the other one, with smooth change in between.

f[grad1_, grad2_] := DensityPlot[Sin[x] Sin[y], {x, -Pi, Pi}, {y, -Pi, Pi},
  ColorFunction -> (mixer[grad1, grad2][#, #] &), Frame -> False,
  PlotRangePadding -> 0, PlotLabel -> Style[grad1 <> "-" <> grad2, 10], PlotPoints -> 40]

GraphicsGrid[Partition[ParallelTable[f[RandomChoice[Complement[ColorData["Gradients"], {"BrightBands", "DarkBands"}]],
    RandomChoice[Complement[ColorData["Gradients"], {"BrightBands", "DarkBands"}]]], {25}], 5], Spacings -> 0, ImageSize -> 800]


A Manipulate to play with blending:
 Manipulate[
  GraphicsGrid[{
    {DensityPlot[x, {x, 0, 1}, {y, 0, .1}, ColorFunction -> gradients1, AspectRatio -> Automatic, Frame -> False]},
    {DensityPlot[x, {x, 0, 1}, {y, 0, .1}, ColorFunction -> (mixer[gradients1, gradients2][m, #] &),
         AspectRatio -> Automatic, Frame -> False]},
    {DensityPlot[x, {x, 0, 1}, {y, 0, .1}, ColorFunction -> gradients2, AspectRatio -> Automatic, Frame -> False]}
    }]
  , {{m, .5, "blend"}, 0, 1, Appearance -> "Labeled"}
  , {{gradients1, "SandyTerrain", "1st palette"}, (# -> Show[ColorData[#, "Image"], ImageSize -> 100]) & /@ ColorData["Gradients"]}
, {{gradients2, "Rainbow", "2nd palette"}, (# -> Show[ColorData[#, "Image"], ImageSize -> 100]) & /@ ColorData["Gradients"]}]
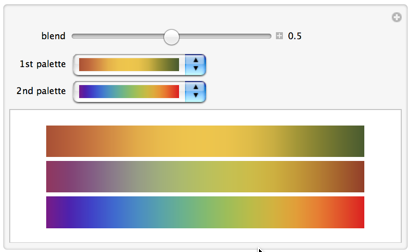


I think these are pretty nice subtle color palettes. Now I have two questions.
  • How do we make the mixer function faster, efficient?
  • How do we do the same for "Indexed" discrete color data ColorData["Indexed"] ?
POSTED BY: Vitaliy Kaurov
6 Replies
Sander, this is great! Thank you for investing yours and your computer time into it ;-)
POSTED BY: Vitaliy Kaurov


As Vitaliy proposed, mixing the colorfunction of Mathematica. Basically this is a table, vertically and horizontally the different colorschemes. Then each sub-block is a blend from one colorfunction to the other. (vertically is the 'blend' for each colorfunction, horizontally is the blend between colorfunctions). 

Here is the code: (note that it is pretty CPU intensive, it will take 10 minutes on a fast machine!)
 ClearAll[ColorBlendData]
 ColorBlendData[colf1_,colf2_,n_Integer]:=Module[{data},
 data=Array[Blend[{Blend[colf1,#1],Blend[colf2,#1]},#2]&,{n,n},{{0,1},{0,1}}];
 Apply[List,data,{2}]
 ]
 n=20;
 b=2;
 colfs=ColorData["Gradients"];
 CloseKernels[];
LaunchKernels[4];
DistributeDefinitions[n,b,colfs,ColorBlendData];
AbsoluteTiming[data=ParallelTable[ColorBlendData[f,g,n],{f,colfs},{g,colfs}];]
data=Flatten[data,{{1,3},{2,4}}];

headerdata=Table[ColorBlendData[f,f,n],{f,colfs}];
headerdatatop=Flatten[Transpose/@headerdata,1]\[Transpose]//Image;
headerdataside=Flatten[headerdata,1]//Image;
topcorner=ConstantArray[{1,1,1},{n,n}]//Image;
img=Image[data];

img=ImagePad[img,2,White];
headerdatatop=ImagePad[headerdatatop,2,White];
headerdataside=ImagePad[headerdataside,2,White];
topcorner=ImagePad[topcorner,2,White];

bottom=ImageAssemble[{headerdataside,img}];
top=ImageAssemble[{topcorner,headerdatatop}];

img=ImageAssemble[{{top},{bottom}}]
(*Export["colorfields.png",img]*)
POSTED BY: Sander Huisman
@Vitaliy
Glad to hear it is faster. I found out using some spelunking that Blend is used when you ask for a color using ColorData. Interesting that it is 3x faster!! Didn't expect that at all.

@Bernat
Nice to hear I have some fans ;) I changed my website completely a month or two ago, I didn't post enough to keep it 'active'. Maybe I will post all my pasta's at some point. I'll let you know emoticon
You got a nice website by the way...
POSTED BY: Sander Huisman
Cool idea Vitaliy! It's always great to expand the artistic capabilities of Mathematica.

Thank you, Sander, for pointing this out. It's great having you in Community. I first heard about your mathematical pasta in 2012 "Pasta Graduates From Alphabet Soup to Advanced Geometry". It would be great if you could share in Community some of these great ideas you got for modeling different types of pasta using Mathematica emoticon

POSTED BY: Bernat Espigulé
Thank you, Sander, interesting observation, - Blend seems to be about 3 times faster than ColorData. I personally like subtle palettes, but mostly for artistic applications. For more contrast mixing of palettes blending ratio should be used as a function too like in the 2nd example I gave.
POSTED BY: Vitaliy Kaurov
Interesting idea, but mixing color schemes leads to 'duller' colors generally, so they work less good compared to the originals I think.

I'm not sure, but it might be faster to directly use Blend instead of ColorData:
ColorData["Rainbow"][x]
=>
Blend["Rainbow", x]
ColorData eventually calles Blend I think, maybe skipping this extra step saves a little time.

Regards!
POSTED BY: Sander Huisman
Reply to this discussion
Community posts can be styled and formatted using the Markdown syntax.
Reply Preview
Attachments
Remove
or Discard

Group Abstract Group Abstract