Message Boards Message Boards

2
|
5977 Views
|
6 Replies
|
8 Total Likes
View groups...
Share
Share this post:

Make a hierarchy/organisational chart?

Posted 5 years ago

Hi,

I want to make hierarchy charts in Mathematica, but I cannot find any good way to do it. First of all I just want to make a simple hierarchy chart from a frying vector, for example an organisational chart. But later let the "nodes" be boxes with pictures, name, position and hyperlinks. Another example can be to decompose a subject like Mathematics into subgroups like analysis, statistics, algebra, etc and then to subsume group like harmonic analysis, complex analysis,...

I tried using Treeplot function, and looked at similar functions like LayerdGraphPlot, Graph etc but I don't feel they are the correct choice and for this basic task there should be something better in Mathematica.

What I tried is the following, where I have problems with e.g. the CEO do not appear at the top and I can not have two people with the same name. Can someone please help me to find a better way?

fun[a_, b_] := Map[a -> # &, b];
layer1 = fun[CEO, {VP1, VP2, VP3}];
layer2a = fun[VP1, {employee1}];
layer2b = fun[VP2, {employee2, employee3}];
layer2c = 
  fun[VP3, {employee4, employee5, employee6, employee7, employee8, 
    employee9}];
layer3a = fun[employee8, {employee10, employee11}];
layer3b = fun[employee9, {employee12}];
layer4 = fun[employee12, {employee13, employee14}];
TreePlot[Flatten[{layer1, layer2a, layer2b, layer2c, layer3a, layer3b,
    layer4}], VertexLabeling -> True, DirectedEdges -> True]
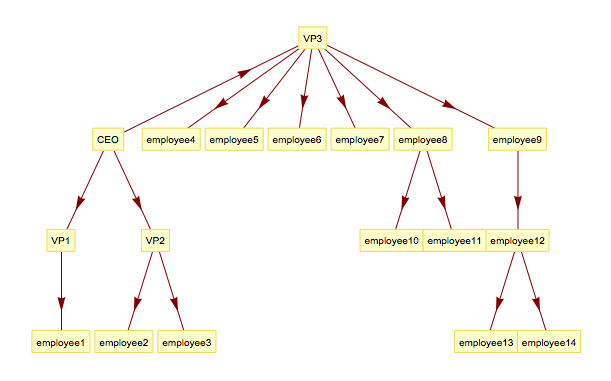
enter image description here

POSTED BY: Kjetil Thorsen
6 Replies

Instead of creating a new function fun, how about just using existing Wolfram Language functionality:

 Thread[Rule["CEO",{"VP1","VP2","VP3"}]]
POSTED BY: Seth Chandler
Posted 5 years ago

Thanks. Yes, this is better.

POSTED BY: Kjetil Thorsen

You might consider a different way of making this diagram. In your cases nested expression logic also works and fixes all your issues:

TreeForm[
    CEO[
       VP1[
         EMP1[
          EMP1,
          EMP2]],
       VP2[
         EMP2,
         EMP3],
       VP3],
DirectedEdges->True]

enter image description here

Another way is to switch to Graph and control which vertex is the root. You will have to explore numerous options Options[Graph] to make it look nicer so, for labels probably with VertexShapeFunction.

fun[a_, b_] := Map[a -> # &, b];
layer1 = fun[CEO, {VP1, VP2, VP3}];
layer2a = fun[VP1, {employee1}];
layer2b = fun[VP2, {employee2, employee3}];
layer2c = 
  fun[VP3, {employee4, employee5, employee6, employee7, employee8, 
    employee9}];
layer3a = fun[employee8, {employee10, employee11}];
layer3b = fun[employee9, {employee12}];
layer4 = fun[employee12, {employee13, employee14}];
Graph[Flatten[{layer1, layer2a, layer2b, layer2c, layer3a, layer3b, 
   layer4}], 
 GraphLayout -> {"LayeredEmbedding", "RootVertex" -> CEO, 
   "Orientation" -> Left}, GraphStyle -> "SimpleLink", 
 AspectRatio -> 1]

enter image description here

POSTED BY: Vitaliy Kaurov
Posted 5 years ago

Thank you for the good suggestions.

Your first suggestion in very elegant and works well on this example. When I use pictures or tables instead of names (or strings like employee11) it has some problems. However, if I transforms the names to pictures or objects afterwards using rules it seems to work ok.

In you second suggestion you specify the rootVertex, this seems like to postpone the problem as this problem might occur further down the three. However, it might be possible to merge threes together where the rootVertex is specified in each of them?

POSTED BY: Kjetil Thorsen

Hi Kjetil,

maybe this serves as a first approximation:

fun[a_, b_] := Map[a -> # &, b];
layer1 = fun[CEO, {VP1, VP2, VP3}];
layer2a = fun[VP1, {employee1}];
layer2b = fun[VP2, {employee2, employee3}];
layer2c = fun[VP3, {employee4, employee5, employee6, employee7, employee8, employee9}];
layer3a = fun[employee8, {employee10, employee11}];
layer3b = fun[employee9, {employee12}];
layer4 = fun[employee12, {employee13, employee14}];
(* using strings is probably better than using symbols: *)
dept = Rule[ToString[#1], ToString[#2]] & @@@ Flatten[{layer1, layer2a, layer2b, layer2c, layer3a, layer3b, 
     layer4}];
(* explicit naming - identical names possible:  *)
vl = {"CEO" -> "John", "VP1" -> "John", Automatic};
Graph[dept, VertexLabels -> vl, ImageSize -> Full, GraphLayout -> "LayeredDigraphEmbedding"]

This gives:

enter image description here

Regards -- Henrik

POSTED BY: Henrik Schachner
Posted 5 years ago

Thank you Henrik for the suggestion.

This is a good next step in what I wrote. I was hoping for something completely different and less involved as this ought to be a basic operation. Especially since Mathematica is (evolving to be) an article and presenter tool.

POSTED BY: Kjetil Thorsen
Reply to this discussion
Community posts can be styled and formatted using the Markdown syntax.
Reply Preview
Attachments
Remove
or Discard

Group Abstract Group Abstract