Hi,
I want to make hierarchy charts in Mathematica, but I cannot find any good way to do it. First of all I just want to make a simple hierarchy chart from a frying vector, for example an organisational chart. But later let the "nodes" be boxes with pictures, name, position and hyperlinks. Another example can be to decompose a subject like Mathematics into subgroups like analysis, statistics, algebra, etc and then to subsume group like harmonic analysis, complex analysis,...
I tried using Treeplot function, and looked at similar functions like LayerdGraphPlot, Graph etc but I don't feel they are the correct choice and for this basic task there should be something better in Mathematica.
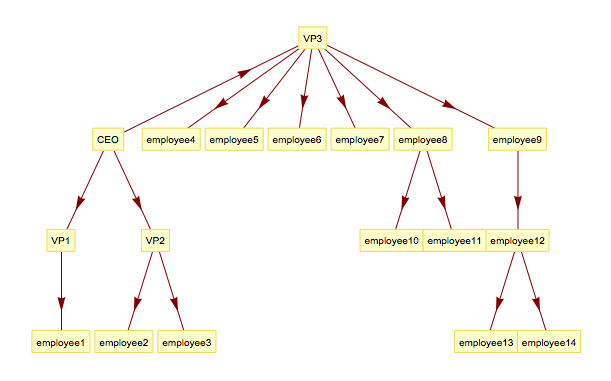
What I tried is the following, where I have problems with e.g. the CEO do not appear at the top and I can not have two people with the same name. Can someone please help me to find a better way?
fun[a_, b_] := Map[a -> # &, b];
layer1 = fun[CEO, {VP1, VP2, VP3}];
layer2a = fun[VP1, {employee1}];
layer2b = fun[VP2, {employee2, employee3}];
layer2c =
  fun[VP3, {employee4, employee5, employee6, employee7, employee8,
    employee9}];
layer3a = fun[employee8, {employee10, employee11}];
layer3b = fun[employee9, {employee12}];
layer4 = fun[employee12, {employee13, employee14}];
TreePlot[Flatten[{layer1, layer2a, layer2b, layer2c, layer3a, layer3b,
    layer4}], VertexLabeling -> True, DirectedEdges -> True]