Message Boards Message Boards

6
|
19424 Views
|
20 Replies
|
39 Total Likes
View groups...
Share
Share this post:

Closed spline going through points

Posted 11 years ago
In the BSplineCurve documentation, under applications / interpolation, instructions for making an open curve going through points is given. 

Similar code is in the Demonstration Knot Vector Generation for B-Spline Interpolation.  It also does open curves. 

I'd like something similar for closed curves.  Given 16 or so points, generate a smooth closed curve going through those points.  

I'm hoping to make a new Demonstration on the Inscribed square problem. The conjecture is that every closed curve has an embedded square.  My idea is to randomly generate the points of 4 squares, do a Traveling Salesman on those points, then draw the interpolated spline through the 16 points.

POSTED BY: Ed Pegg
20 Replies
Posted 9 years ago

I was demonstrating the "path" tool in GIMP. I recorded the GIF with LICEcap.

POSTED BY: Michael Hale
Posted 9 years ago

Dear @Michael Thanks sincerely! . I can understand your method by the following code and your detailed explonation?)

pts = {{0, 0}, {1, 0}, {2, .5}, {1, 1}, {0, 1}, {2, 2}};
Graphics[{Hue[RandomReal[]], #}] & /@
    (BSplineCurve@{#2, #2 + (#3 - #)/4, #3 - (#4 - #2)/4, #3} & @@@ 
    Partition[pts, 4, 1, {2, 2}]) // Show

enter image description here

So this solution is a method that based on the cubic B-spline. Lastly, I would like to know which sofeware/tools did you use to generate the following animation.

enter image description here

POSTED BY: Shutao Tang
Posted 9 years ago

Hi Shutao,

Many image editing an animation programs have a standard interface for editing cubic B-spline curves that pass through a set of points. Typically the user clicks to place down the interpolation points, and then the program generates two "handle" points associated with each interpolation point. So the middle red part of the curve below is a spline generated from the two red interpolation points and the two red handle points that stick out of them.

enter image description here

From the following animations you can see that adjacent parts of the overall curve will be smooth if an interpolation point and its two handle points are all co-linear.

enter image description here enter image description here

So a reasonable way to automatically place the handle points to generate a simple curve is shown below. Given interpolation points in red, we can generate the points for the B-spline segment between red points 2 and 3 in blue:

enter image description here

The first point is just red point 2 and the fourth is just red point 3:

{#2, ..., ..., #3}&

The second point is a location that starts at red point 2, and extends a short distance parallel to the line connecting red point 1 and 3.

{#2, #2+(#3-#)/4, ..., #3}&

Now when we are generating the third point for the segment connecting interpolation points 1 and 2, it will also start at point 2 and extend in the opposite direction parallel to the line connecting points 1 and 3. This will make the handles of point 2 co-linear, so the segment connecting points 1 and 2, and 2 and 3 will be smooth.

POSTED BY: Michael Hale
Posted 9 years ago

Dear @Michael I would like to know what theory did you use to write the following code:

  BSplineCurve@{#2, #2 + (#3 - #)/4, #3 - (#4 - #2)/4, #3} & @@@ Partition[pts, 4, 1, {2, 2}]

In addition, is your theory suit for other degree?For instance, like $p=4,5$

thanks sincerely!

POSTED BY: Shutao Tang
And here the reverse problem:
 CreateScene[pts_List,{a_,b_}]:=Module[{points,order,smooth,splinepoints,splnfunc,p1,p2,p3,p4,d,e},
 order=FindShortestTour[pts][[2]];
 points=pts[[order]];
 splinepoints={#2,#2+Normalize[#3-#] Norm[#3-#2]/3,#3-Normalize[#4-#2] Norm[#3-#2]/3,#3}&@@@Partition[points,4,1,{2,2}];
 smooth=BSplineCurve[Flatten[splinepoints,1],SplineDegree->3];
 splnfunc=BSplineFunction[Flatten[splinepoints,1],SplineDegree->3];
 p1=splnfunc[a];
 p2=splnfunc[b];
 d=p2-p1;
e={-1,1}Reverse[d];
p3=e+p2;
p4=p3-d;
Graphics[{smooth,Blue,PointSize[0.04],Point[p1],Black,Point[p2],Green,Point[p3],Point[p4]},PlotRange->3/2]
]
pt0=RandomReal[{-1,1},{6,2}];
Manipulate[CreateScene[pt,{a,b}],{{pt,pt0},Locator,Appearance->Graphics[{Red,PointSize[0.02],Point[{0,0}]}]},{{a,0},0,1},{{b,0.5},0,1}]
giving:

You can freely move the 6 red points, and move the blue and black dots around the contour, the greens one are created and should fit on the contour.
POSTED BY: Sander Huisman
Here I made the interactive example:
 ClearAll[CreateSquare,CreateScene]
 CreateSquare[p:{px_,py_},L_,\[Theta]_]:=With[{\[Phi]=Range[0,3\[Pi]/2,\[Pi]/2]+\[Theta]}, {px+Cos[\[Phi]]L/2,py+Sin[\[Phi]]L/2}\[Transpose]]
 CreateScene[p:{p1_,p2_,p3_},L:{l1_,l2_,l3_,l4_},\[Theta]:{\[Theta]1_,\[Theta]2_,\[Theta]3_,\[Theta]4_},showsqrs_]:=Module[{plg,allpoints,order,smooth},
 plg=MapThread[CreateSquare,{Append[p,{0,0}],L,\[Theta]}];
 allpoints=Flatten[plg,1];
 order=FindShortestTour[allpoints][[2]];
 allpoints=Part[allpoints,order];
 smooth=BSplineCurve@{#2,#2+Normalize[#3-#] Norm[#3-#2]/3,#3-Normalize[#4-#2] Norm[#3-#2]/3,#3}&@@@Partition[allpoints,4,1,{2,2}];
 If[showsqrs,
Graphics[{EdgeForm[{Darker@Blue,Thickness[0.003]}],FaceForm[None],Polygon[Most@plg],{EdgeForm[Thickness[0.005]],Polygon[Last@plg]},Black,PointSize[0.04],Point[allpoints],CapForm[None],Dashing[0.0125],Thickness[0.008],smooth},PlotRange->2]
,
Graphics[{Black,CapForm[None],Dashing[0.0125],Thickness[0.008],smooth},PlotRange->2]
]
]
Manipulate[
CreateScene[{p1,p2,p3},{size1,size2,size3,size4},{\[Theta]1,\[Theta]2,\[Theta]3,\[Theta]4},show]
,
{{p1,{1,0},"Position #1"},{-1,-1},{1,1}},
{{size1,0.98,"Size #1"},0.2,2},
{{\[Theta]1,1.57,"Angle #1"},0,2\[Pi]},
Delimiter,
{{p2,{-0.8,1},"Position #2"},{-1,-1},{1,1}},
{{size2,1.28,"Size #2"},0.2,2},
{{\[Theta]2,3.68,"Angle #2"},0,2\[Pi]},
Delimiter,
{{p3,{-0.8,-1},"Position #3"},{-1,-1},{1,1}},
{{size3,1.3,"Size #3"},0.2,2},
{{\[Theta]3,0.3,"Angle #3"},0,2\[Pi]},
Delimiter,
{{size4,2.25,"Size Center"},1,3},
{{\[Theta]4,0.21,"Angle Center"},0,2\[Pi]},
Delimiter,
{{show,True,"Show Squares"},{True,False}}
]
giving:
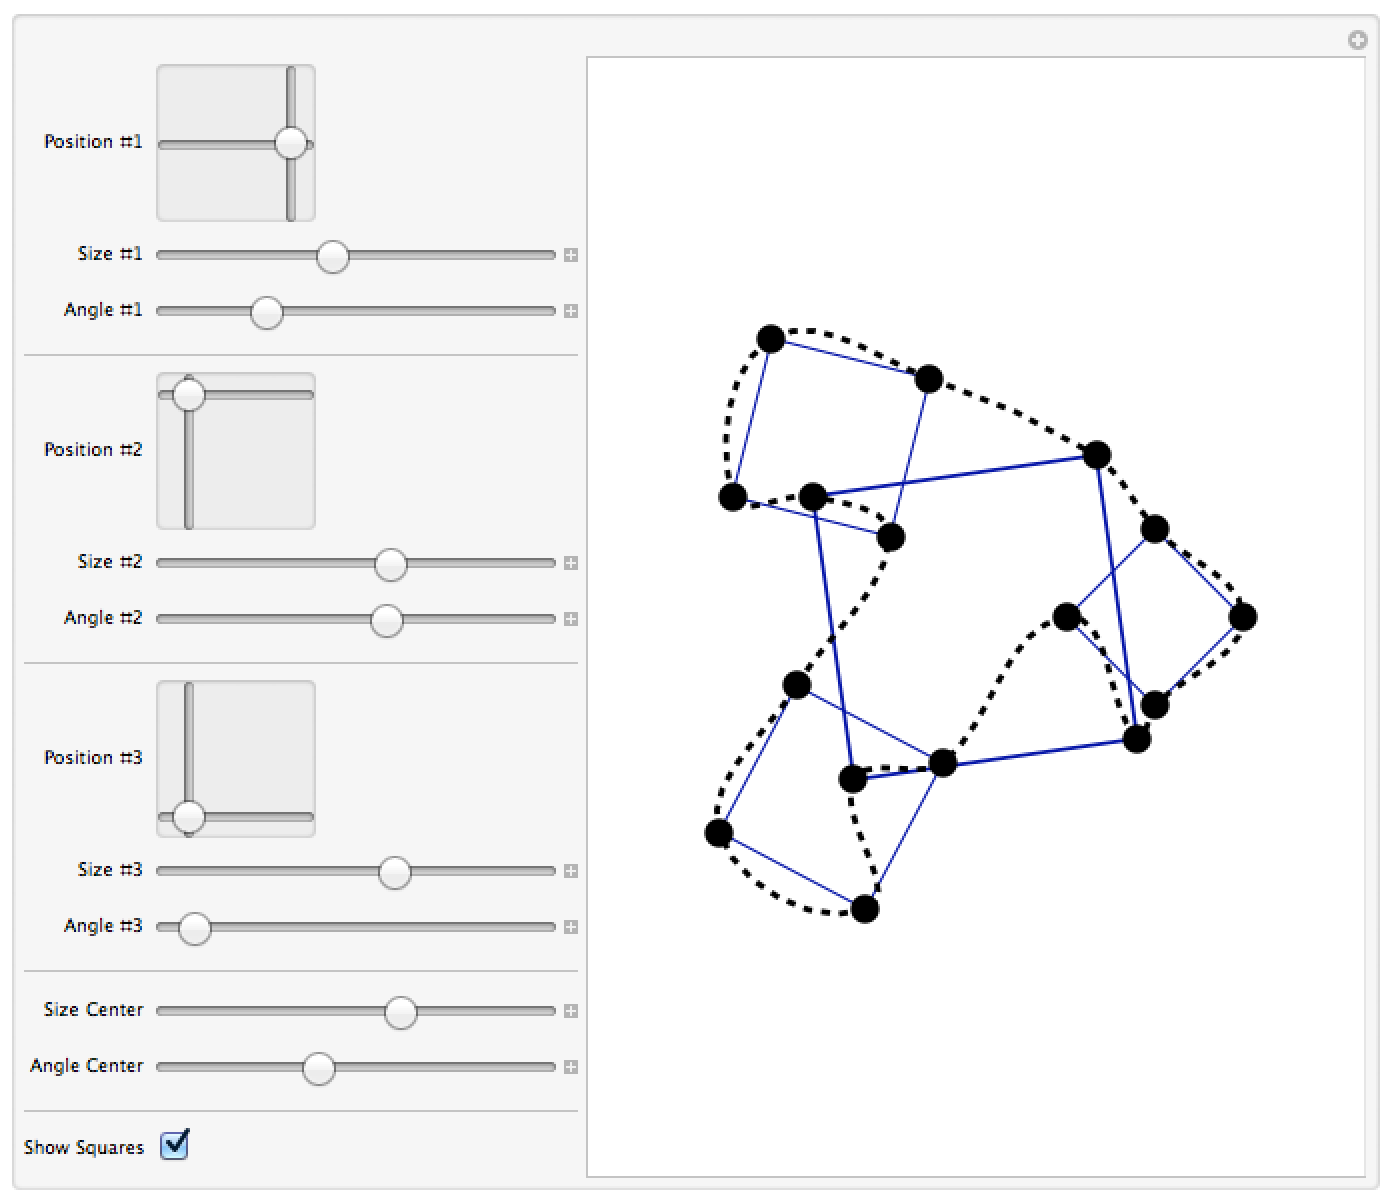
POSTED BY: Sander Huisman
I had an error in my code, the L/2 was outside the braces, now it is inside. I updated the above post.
POSTED BY: Sander Huisman
Posted 11 years ago
These curves look gorgeous.  

I was thinking of combining the Demonstration A Polygon from Its Midpoints with Vitaly's midpoint-based code.  These curves that are generated look very nice -- I'd want to be able to switch the squares on and off -- is it possible to spot where a square might be in a curve?
POSTED BY: Ed Pegg
Posted 11 years ago
I've started the packages for "Square", "Spline interpolation", and the "Inscribed square problem" on Wikicode.

POSTED BY: Michael Hale
I think I kinda made what the author requested:
 ClearAll[CreateSquare,CreateRandomSquares,CreateScene]
 CreateSquare[p:{px_,py_},L_,\[Theta]_]:=Module[{\[Phi]},\[Phi]=Range[0,3\[Pi]/2,\[Pi]/2]+\[Theta]; {px+Cos[\[Phi]]L/2,py+Sin[\[Phi]]L/2}\[Transpose]]
 CreateRandomSquares[n_]:=Module[{r,L,\[Phi],\[Theta],sqrs},r=RandomReal[{0.2,0.45},n];
 \[Phi]=Range[0,(1-1/n)2\[Pi],2\[Pi]/n];
 \[Theta]=RandomReal[{0,2\[Pi]},n];
 L=RandomReal[{0.3,0.5},n];
 sqrs=MapThread[CreateSquare[#1{Cos[#3],Sin[#3]},#2,#4]&,{r,L,\[Phi],\[Theta]}];
 Append[sqrs,CreateSquare[{0,0},0.75,RandomReal[{0,2\[Pi]}]]]]
 CreateScene[]:=Module[{plg,allpoints,order,smooth},plg=CreateRandomSquares[3];
allpoints=Flatten[plg,1];
order=FindShortestTour[allpoints][[2]];
allpoints=Part[allpoints,order];
smooth=BSplineCurve@{#2,#2+Normalize[#3-#] Norm[#3-#2]/3,#3-Normalize[#4-#2] Norm[#3-#2]/3,#3}&@@@Partition[allpoints,4,1,{2,2}];
Graphics[{EdgeForm[{Darker@Blue,Thickness[0.003]}],FaceForm[None],Polygon[Most@plg],{EdgeForm[Thickness[0.005]],Polygon[Last@plg]},Black,PointSize[0.04],Point[allpoints],Dashing[0.025],Thickness[0.008],smooth}]]
pic=CreateScene[];
Button["Click Here",pic=CreateScene[]]
Dynamic[pic]
giving:
POSTED BY: Sander Huisman
This is really nice thinking Michael- great!
POSTED BY: Vitaliy Kaurov
Posted 11 years ago
@Sander, Thanks! It is probably better to scale the "handle lengths" based on the distance to the next point, so it looks smoother when the points are less evenly spaced.
Manipulate[
Graphics[BSplineCurve@{#2, #2 +
       Normalize[#3 - #] Norm[#3 - #2]/3, #3 -
       Normalize[#4 - #2] Norm[#3 - #2]/3, #3} & @@@
   Partition[pts, 4, 1, {2, 2}],
  ImageSize -> {400,
    300}], {{pts, {{0, 0}, {1, 0}, {2, .5}, {1, 1}, {0, 1}}}, Locator,
   LocatorAutoCreate -> True}]
POSTED BY: Michael Hale
@Michael

That is very very neat! wow! Nice way of using Partition to make it cyclic!
POSTED BY: Sander Huisman
Posted 11 years ago
Truthfully, based on my experience with Photoshop and other programs that let you draw splines I wouldn't have approached this in a manner as mathematically elegant as the example in the documentation. This is closer to Vitaliy's last post.
Manipulate[
Graphics[BSplineCurve@{#2, #2 + (#3 - #)/4, #3 - (#4 - #2)/4, #3} & @@@
    Partition[pts, 4, 1, {2, 2}],
  ImageSize -> {400,
    300}], {{pts, {{0, 0}, {1, 0}, {2, .5}, {1, 1}, {0, 1}}}, Locator,
   LocatorAutoCreate -> True}]
POSTED BY: Michael Hale
There is also another approach. For SplineDegree -> 2 the centers of segments connecting the points are always on the curve:
Manipulate[
Graphics[{BSplineCurve[pts, SplineClosed -> True, SplineDegree -> 2],
          {Red, PointSize[Large], Point[Mean /@ Partition[pts, 2, 1, 1]]}},
          ImageSize -> {400, 300}],
{{pts, {{0, 0}, {1, 0}, {2, .5}, {1, 1}, {0, 1}}}, Locator, LocatorAutoCreate -> True}]

POSTED BY: Vitaliy Kaurov
@Vitaliy @Michael

Indeed; if you look at the matrix m that is created you see that in certain rows only 1 non-zero value is. A neat way would be to make it a n-diagonal matrix with the two corners (top right, bottom left) filled with some numbers in order to make it cyclic.
POSTED BY: Sander Huisman
Posted 11 years ago
Maybe you would want to copy the first 4 points to the end of the list instead of just the first point. That would help with the continuity issue if you adjusted the basis matrix so that the first 4 elements in the first row were the same as the last 4 elements in the last row. I'd need to think about it some more.
POSTED BY: Michael Hale
This is neat idea to make the last point to be equal to the first to make a loop. And I think you are talking about this example. But I think the joining point behaves differently then the rest. It seems to me derivative is discontinues there. Here a quick manipulate to play with:
 Manipulate[
  pts = Append[pt, First[pt]];
  n = Length[pts];
  dist = Accumulate[
    Table[EuclideanDistance[pts[[i]], pts[[i + 1]]], {i,
      Length[pts] - 1}]];
  param = N[Prepend[dist/Last[dist], 0]];
  knots = Join[ConstantArray[0, 3], Range[0, 1, 1/(n - 3)],
    ConstantArray[1, 3]];
m = Table[
   BSplineBasis[{3, knots}, j - 1, param[[i]]], {i, n}, {j, n}];
ctrlpts = LinearSolve[m, pts];
ListPlot[pts, Prolog -> BSplineCurve[ctrlpts],
  PlotStyle -> Directive[Red, PointSize[Large]],
  PlotRangePadding -> 1/2, Frame -> True, Axes -> False]
, {{pt, {{1, 1}, {2, 1.25}, {2, 2}, {1.5, 2.75}, {1, 3}, {0.5,
     2.5}, {0.5, 1.1}}}, Locator, Appearance -> None,
  LocatorAutoCreate -> True}]

POSTED BY: Vitaliy Kaurov
I just played around with it but I'm not fully up-to-date how the knots are implemented and the syntax, but I generalized the example:
 pts={{1,1},{2,1.25},{2,2},{1.5,2.75},{1,3},{0.5,2.5},{0.5,1.1},{1,1}};
 n=Length[pts];
 dist=Accumulate[Table[EuclideanDistance[pts[[i]],pts[[i+1]]],{i,Length[pts]-1}]];
 param=N[Prepend[dist/Last[dist],0]];
 knots=Join[ConstantArray[0,3],Range[0,1,1/(n-3)],ConstantArray[1,3]];
 m=Table[BSplineBasis[{3,knots},j-1,param[[i]]],{i,n},{j,n}];
 MatrixForm[m]
 ctrlpts=LinearSolve[m,pts];
 ListPlot[pts,Prolog->{Blue,Arrow[pts],Black,BSplineCurve[ctrlpts]},PlotStyle->Directive[Red,PointSize[Large]],PlotRangePadding->1/2]

You can add points and so on, I think what has to be is, is the following: As you can see the matrix that is solved is quad-diagonal, I think we need some terms in the top-right and bottom-left of the matrix on order to make the spline 'cyclic'. I'm yet to figures out how to do that... but that is the idea I think...
POSTED BY: Sander Huisman
I think it is pretty neat idea for a Demonstration. Making a closed spline is pretty easy though. It is mentioned in the same documentation article a little deep down. Basically 
pts = RandomReal[1, {16, 2}];
Graphics[{BSplineCurve[pts, SplineClosed -> True], {Red, PointSize[Large], Point[pts]}}]


But according to that picture you are probably looking for curve passing through points - so you would need an interpolation. There is spline-based interpolation, but thankfully there is a simpler trick. If you repeat every point a few times - even only two - spline becomes very close to points. You can control how close with how many times you repeat same point and with option SplineDegree:
Graphics[{BSplineCurve[Flatten[Thread[{pts, pts}], 1],
   SplineClosed -> True, SplineDegree -> 3], {Red, PointSize[Large], Point[pts]}}]


BTW this cool Demonstration by Jaime Rangel-Mondragon uses closed spline:

The Path of the Rear Wheels of a Bus

POSTED BY: Vitaliy Kaurov
Reply to this discussion
Community posts can be styled and formatted using the Markdown syntax.
Reply Preview
Attachments
Remove
or Discard

Group Abstract Group Abstract