Group Abstract Group Abstract

Message Boards Message Boards

8
|
23K Views
|
8 Replies
|
13 Total Likes
View groups...
Share
Share this post:

Cobweb plot in Mathematica

Because Mathematica does not have this function (yet) I give here a simple way to produce a cobweb plot: http://en.wikipedia.org/wiki/Cobweb_plot
The code is quite short and does the basics:
 ClearAll[CobwebPlot]
 Options[CobwebPlot]=Join[{CobStyle->Automatic},Options[Graphics]];
 CobwebPlot[f_,start_?NumericQ,n_,xrange:{xmin_,xmax_},opts:OptionsPattern[]]:=Module[{cob,x,g1,coor},
  cob=NestList[f,N[start],n];
  coor = Partition[Riffle[cob,cob],2,1];
  coor[[1,2]]=0;
  cobstyle=OptionValue[CobwebPlot,CobStyle];
  cobstyle=If[cobstyle===Automatic,Red,cobstyle];
  g1=Graphics[{cobstyle,Line[coor]}];
Show[{Plot[{x,f[x]},{x,xmin,xmax},PlotStyle->{{Thick,Black},Black}],g1},FilterRules[{opts},Options[Graphics]]]
]
The function works as follows:
CobwebPlot[f,start,n,xrange,...]
Where 
f is a pure function
start is the starting value
n is number of iterations
xrange is a the range of the plot and should have the form: {xminimum,xmaximum}.

The color of the cobweb can be given by a CobStyle option, additionally one can add other options as well (those of Graphics).

Examples:
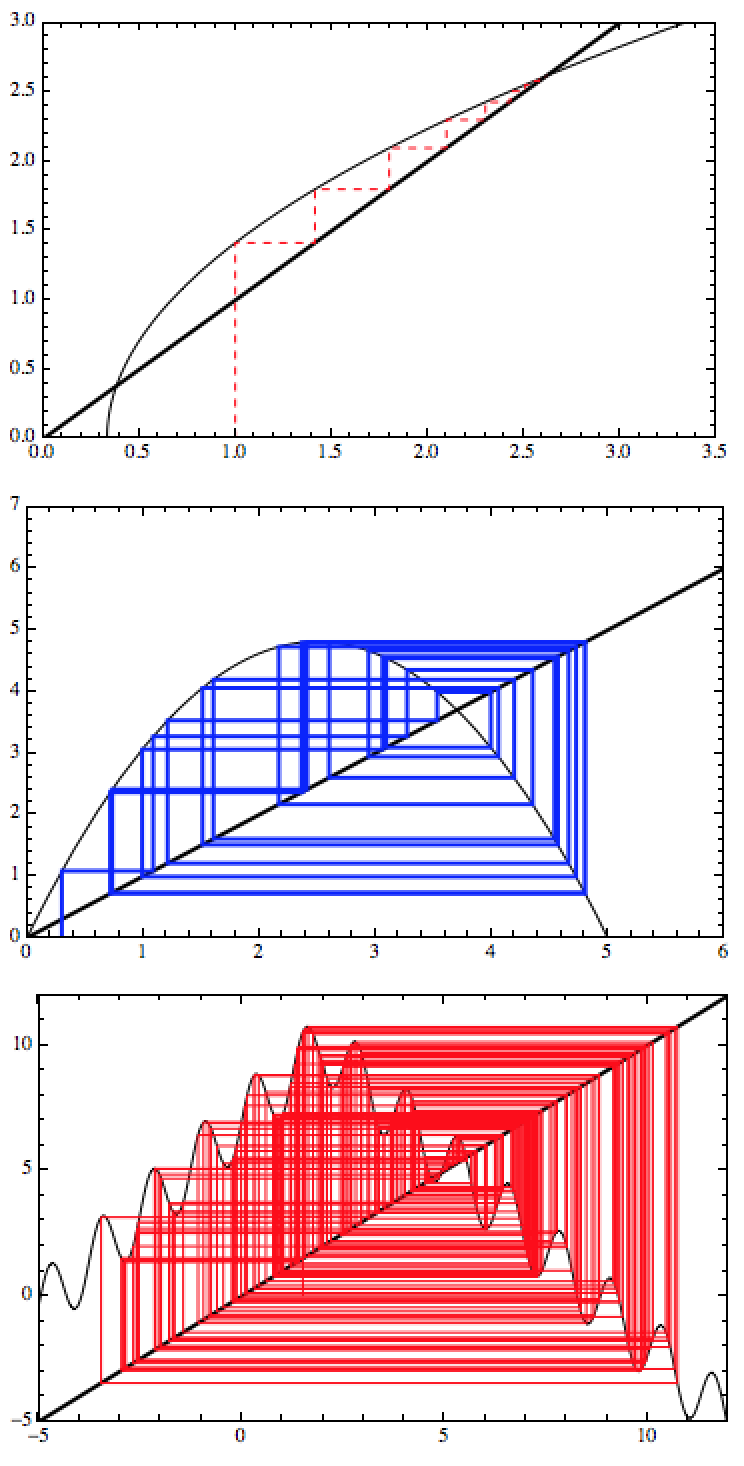
CobwebPlot[Sqrt[3#-1]&,1,40,{0,4},PlotRange->{{0,3.5},{0,3}},Frame->True,Axes->False,CobStyle->Directive[Dashed,Red],PlotRangePadding->None]
CobwebPlot[0.77#(5-#)&,0.3,30,{0,10},PlotRange->{{0,6},{0,7}},Frame->True,Axes->False,CobStyle->Directive[Blue,Thick],PlotRangePadding->None]
CobwebPlot[10-1.5Abs[#-2]+1.35Sin[5#]&,1.5,230,{-5,12},PlotRange->{Automatic,{-5,12}},Frame->True,Axes->False,CobStyle->Red,PlotRangePadding->None]
giving:

Of course this can be used together with Manipulate like so:
Manipulate[CobwebPlot[Sqrt[3#-1]&,\[Alpha],40,{0,5},PlotRange->{{0,4.5},{0,3.65}},Frame->True,Axes->False,CobStyle->Directive[Dashed,Red],PlotRangePadding->None],{\[Alpha],0.5,4.375}]
giving:


I hope this will be useful. Let me know if you can't get it to work.
POSTED BY: Sander Huisman
8 Replies
Great, Sander, I love those! Nice animated GIF too. I wrote a few cobweb Demonstrations myself - see for example the image below. Demonstrations Project have several cobwebs:

POSTED BY: Vitaliy Kaurov

Change the

PlotStyle->{{Thick,Black},Black}]

part to some different colors/style…

POSTED BY: Sander Huisman

Something like:

CobwebPlot[
 Piecewise[{{2 # + 3, # <= 0}, {0.7 # + 4, # > 0}}] &,
 -1.23, 40, {-15, 15}]
POSTED BY: Sander Huisman

Thank you sir.

In the above Code, if I want to Take two initial conditions - one at -1.23 and say other at 2.5, so in Cobweb plots can we show two orbits? I tried following code:

CobwebPlot[
 Piecewise[{{2 # + 3, # <= 0}, {0.7 # + 4, # > 0}}] &, {{-1.23, 40}, {2.5, 40}}, {-15, 15}]

But it didn't work.

Also I want to plot Basin of Attraction plot for the same basic piecewise system.

POSTED BY: Rajanikant Metri

Thank You Sir. Can we change the colour of 2x+3 line and 0.7x+4 line? By default it is Black, how to modify the colour of these lines?

POSTED BY: Rajanikant Metri
Show[{CobwebPlot[2 # &, 2, 40, {-15, 15}],
  CobwebPlot[3 # &, 2, 40, {-15, 15}, CobStyle -> Blue]
  }]
POSTED BY: Sander Huisman

Sir, I have piecewise equation

 f = Piecewise[{{a x + m, x <= 0}, {b x + n, x > 0}}]

For this "f" how to plot Cobweb plot? Thank You.

POSTED BY: Rajanikant Metri

Can we use a single plot to represent a cobweb of 1/2 under functions f(x) = 2x and g(x) =3x. So that we can compare their orbit under two distinct functions using one plot.

Reply to this discussion
Community posts can be styled and formatted using the Markdown syntax.
Reply Preview
Attachments
Remove
or Discard