Message Boards Message Boards

0
|
5672 Views
|
4 Replies
|
5 Total Likes
View groups...
Share
Share this post:

Correlation between events from a set of customers

Posted 11 years ago
Hi again. Sorry for asking so many questions to the community, but one more.
I have many datasets on CSV files, on the following format:
<Snippet>
11623.8,  126213.
188205., 247421.
312914., 361412.
562093., 627725.
797796., 881782.
910289., 927101.
etc..</Snippet>

These values are time stamps for an event. First value on line is when it starts, second value on line when it ends. Each data set corresponds to one customer, ref. picture. What I would like to do is to create the graph at the bottom. What should I do? Listcorrelate on some form, or...?


Best regards,
Erik
POSTED BY: Erik Sorensen
4 Replies
Mathematica naturally handles this type of problem smoothly with concise code. A quick way is to create a count function "f" that counts one customer if he or she is on phone during the start time to end time. Otherwise do not count.

Here is the implementation:
f[{start_,end_},t_]:=If[start<t<end,1,0];
Now lets work on a set of numbers: 
ls = {{1, 2}, {1.5, 3}, {0.5, 5}};
So the first customer called in for refund at time point 1 and your customer service guy successfully turned him or her down at time 2. Similar things happened to the second and the third.
Lets visualize this process. At any moment the number of customers online is: (Map- /@- the f over a list)
In[8]:= Total[f[#,t]&/@ls]
Out[8]= If[0.5<t<5,1,0]+If[1<t<2,1,0]+If[1.5<t<3,1,0]
Therefore, as we insert everything into one place, the plot funciton looks like
Plot[Evaluate@Total[f[#, t] & /@ ls], {t, 0, 6}, Filling -> Axis]

POSTED BY: Shenghui Yang
Now we have some persistant customers who really want their money back. Assume we have 20 such customers and calls repeated to dispute. The number of call events may vary (though 50 is set, but Union will remove the duplications in undertermined way)
In[44]:= test=RandomInteger[{1,100},{50,20}];
In[47]:= timeStamp=Union/@test;
In[49]:= timeStamp[[1]]
Out[49]= {6,7,12,13,14,17,18,21,27,32,34,35,39,50,74,77,90,97}
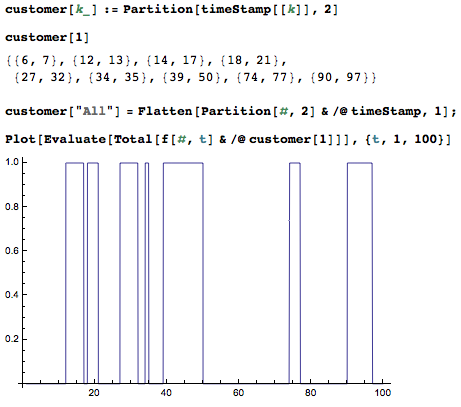
For the 1 customer, whose events are recorded in timeStamp[[1]], called in at time 6 and hold off at 7. Then he called again  at 12 and stopped at 13 because of the annoying music in the phone. So on so forth. Same thing applies to other customers. The profile of each customer is visaulized in the following way: 

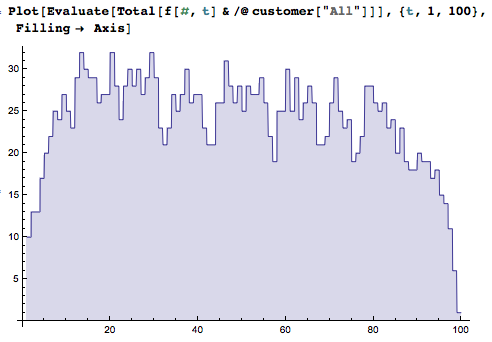
Using a very similar code to the individual case, you can plot for the whole group: 

Code:
preprocessings 
test=RandomInteger[{1,100},{50,20}];
timeStamp=Union/@test;
customer[k_]:=Partition[timeStamp[[k]],2]
customer["All"] = Flatten[Partition[#, 2] & /@ timeStamp, 1];
In[50]:= customer[1]
Out[50]= {{6,7},{12,13},{14,17},{18,21},{27,32},{34,35},{39,50},{74,77},{90,97}}
Visualization: 
Plot[Evaluate[Total[f[#,t]&/@customer[1]]],{t,1,100}]
Plot[Evaluate[Total[f[#,t]&/@customer["All"]]],{t,1,100},Filling-> Axis]
POSTED BY: Shenghui Yang
Posted 11 years ago
Thank you Shenghui.

I see now that I might should have specified a bit more.
What if I have hundreds of customers, each producing thousands of events?

Best regards, 
Erik
POSTED BY: Erik Sorensen
Posted 11 years ago
Thank you very much. Just what I needed! :-)

73 from LA8HTA
POSTED BY: Erik Sorensen
Reply to this discussion
Community posts can be styled and formatted using the Markdown syntax.
Reply Preview
Attachments
Remove
or Discard

Group Abstract Group Abstract