Now we have some persistant customers who really want their money back. Assume we have 20 such customers and calls repeated to dispute. The number of call events may vary (though 50 is set, but Union will remove the duplications in undertermined way)
In[44]:= test=RandomInteger[{1,100},{50,20}];
In[47]:= timeStamp=Union/@test;
In[49]:= timeStamp[[1]]
Out[49]= {6,7,12,13,14,17,18,21,27,32,34,35,39,50,74,77,90,97}
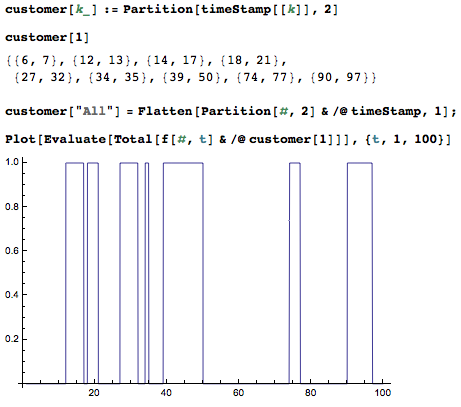
For the 1 customer, whose events are recorded in timeStamp[[1]], called in at time 6 and hold off at 7. Then he called again at 12 and stopped at 13 because of the annoying music in the phone. So on so forth. Same thing applies to other customers. The profile of each customer is visaulized in the following way:

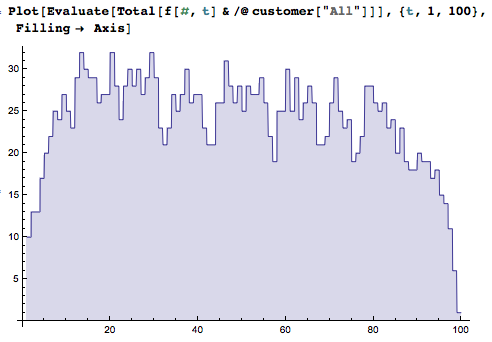
Using a very similar code to the individual case, you can plot for the whole group:

Code:
preprocessings
test=RandomInteger[{1,100},{50,20}];
timeStamp=Union/@test;
customer[k_]:=Partition[timeStamp[[k]],2]
customer["All"] = Flatten[Partition[#, 2] & /@ timeStamp, 1];
In[50]:= customer[1]
Out[50]= {{6,7},{12,13},{14,17},{18,21},{27,32},{34,35},{39,50},{74,77},{90,97}}
Visualization:
Plot[Evaluate[Total[f[#,t]&/@customer[1]]],{t,1,100}]
Plot[Evaluate[Total[f[#,t]&/@customer["All"]]],{t,1,100},Filling-> Axis]