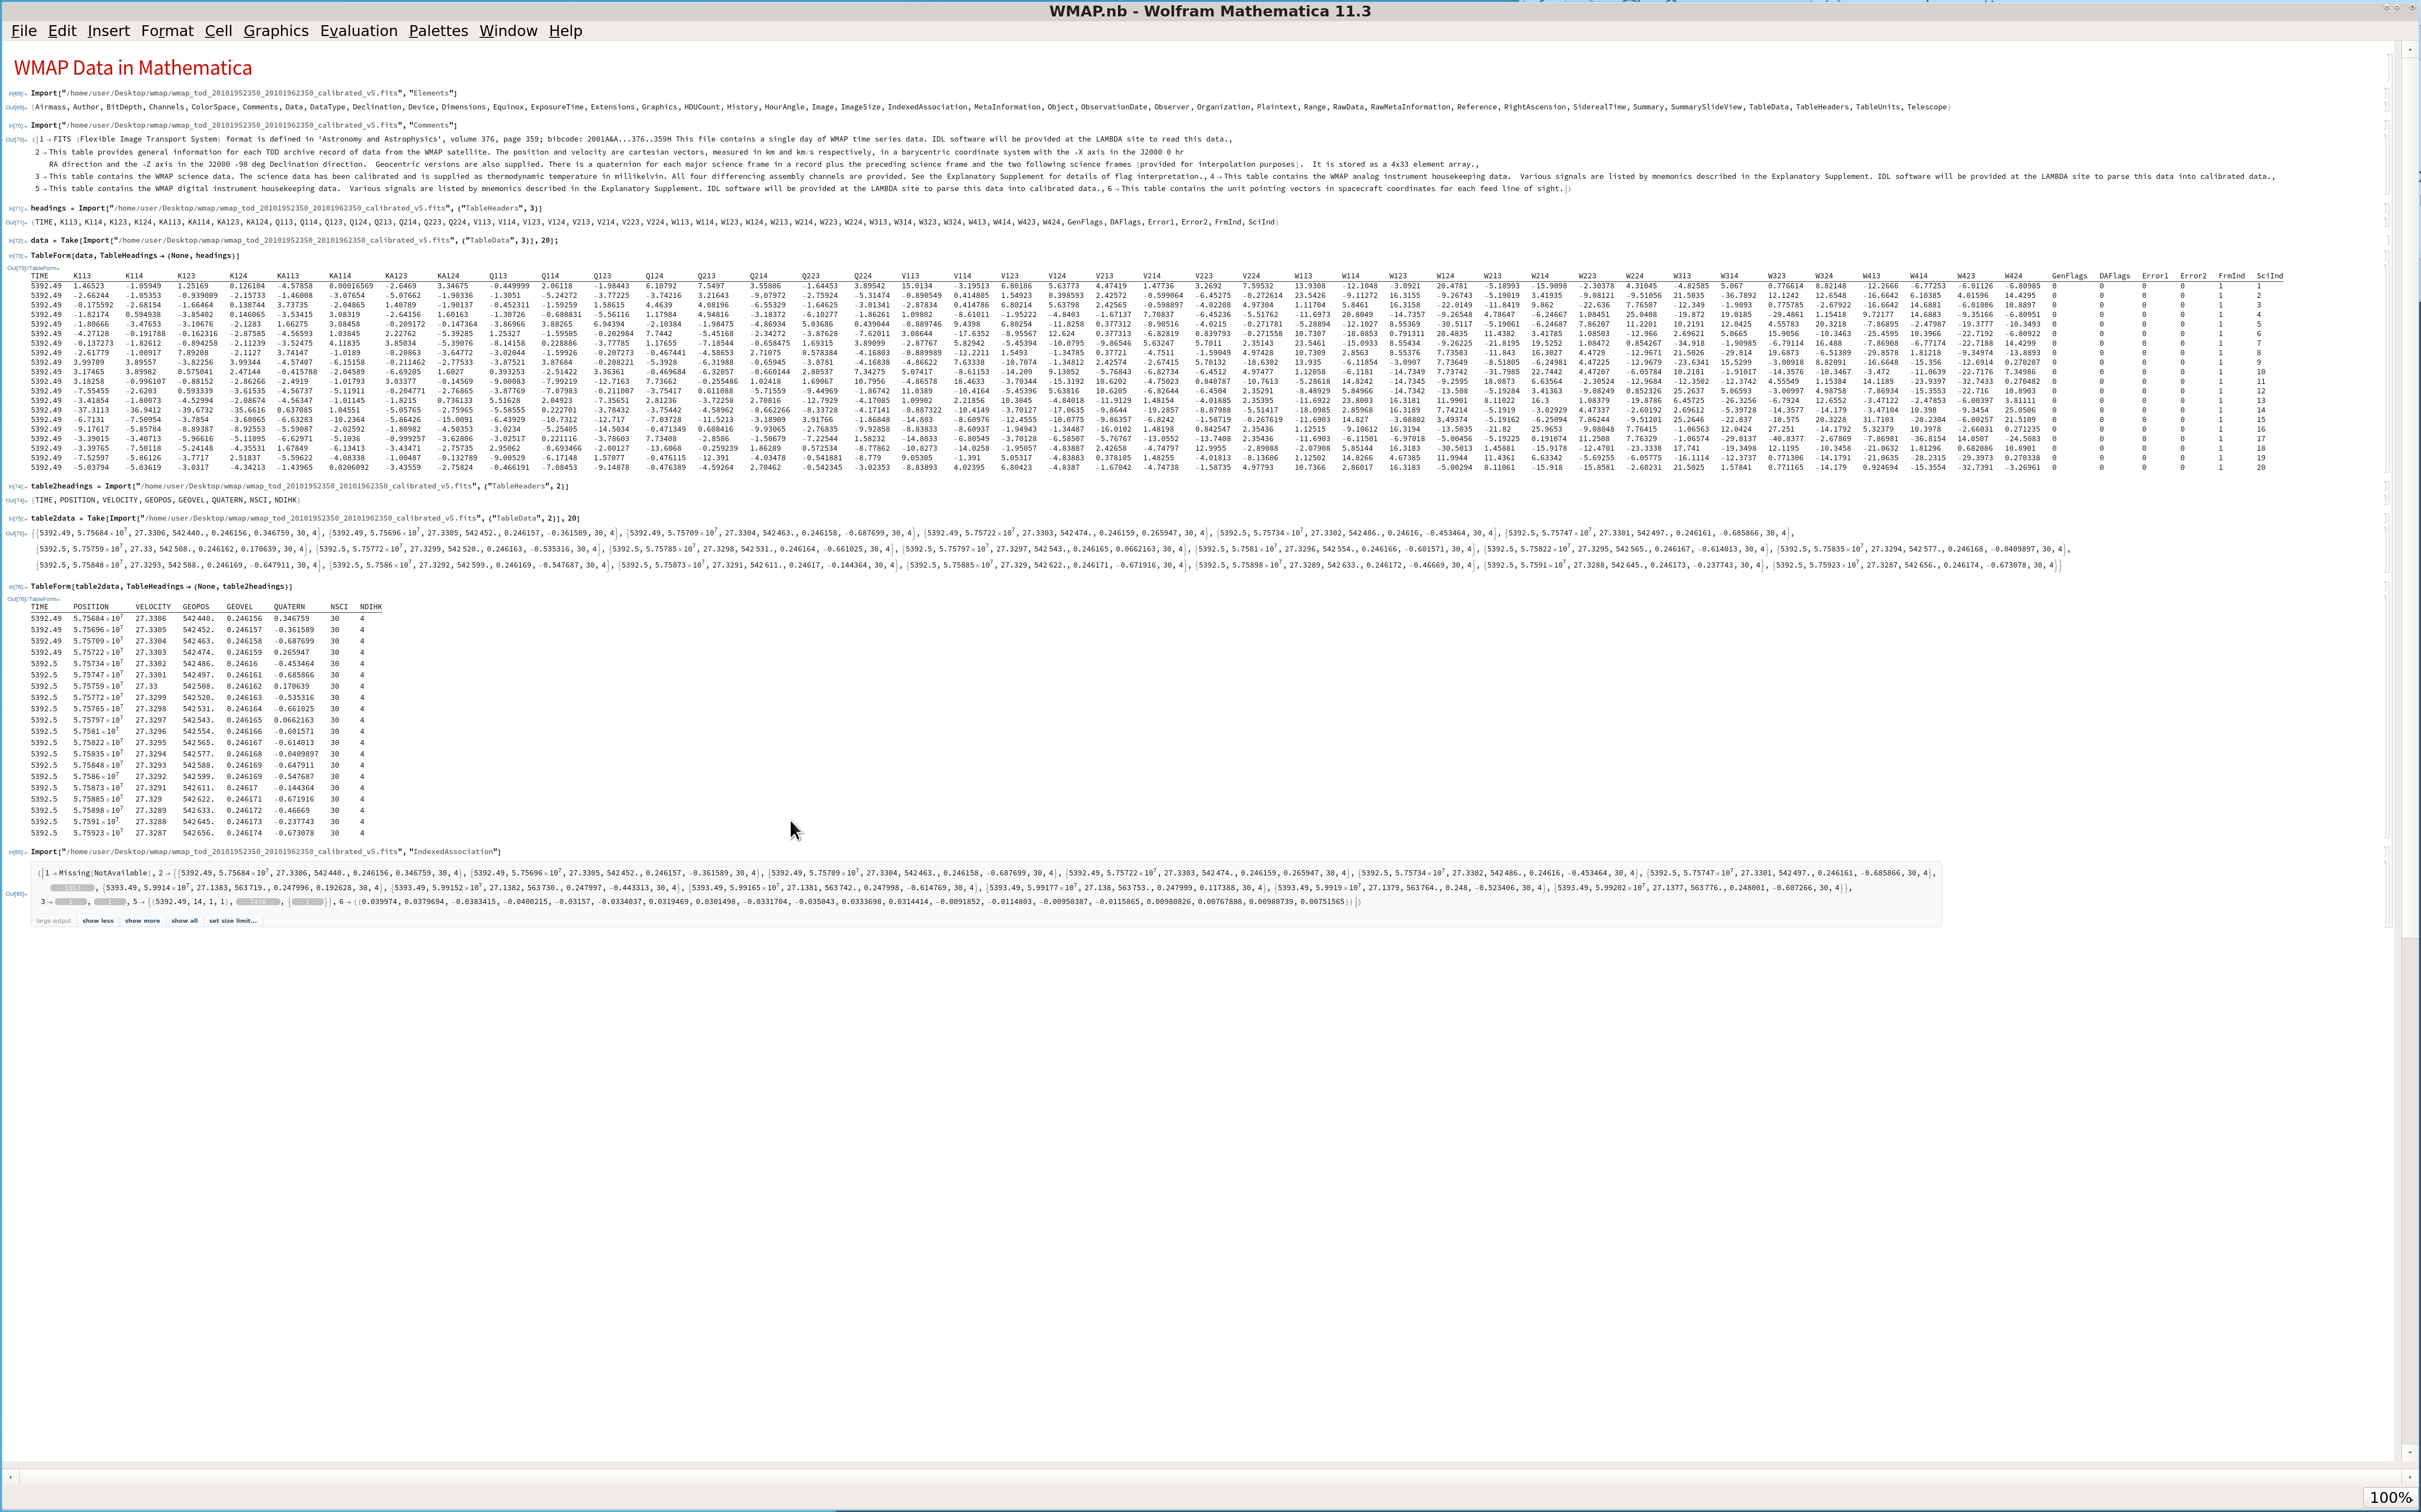
I've been wanting to analyze WMAP data statistically for a while now in order to evaluate the non-Gaussianity of various portions of the WMAP data. Mathematica natively supports FITS files, which are apparently the standard in astronomy. So I have set about working with FITS files from the WMAP mission. It's a lot harder than I expected; the files are massive collections of data points and they are somewhat clumsy to work with. Here is my first several hours of effort on day one:  As you can see, this is not ideal. I had to scale down the notebook on a huge screen to show even the first twenty rows of data from each table (there are tens of thousands of rows and at least 2.5 million data points in each FITS file). Getting from here to generating meaningful statistics and images is going to be pretty rough.
I spoke with one of the creators of HEALPix, Dr. Kristof Gorsky at JPL, and there is some interest in a Mathematica port of HEALPix. Looking at the code, it looks possible but will be a lot of effort. I am wondering if anyone shares my interest in this or if this is going to be a solo project (lol). Thanks.