Hello,
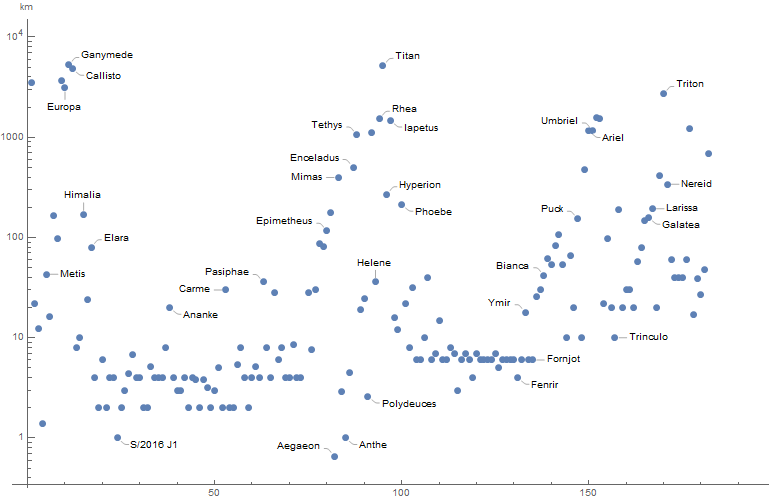
I've been experimenting with Mathematica and wanted to make a nice plot comparing the diameter of the moons in the solar system. I have a plot that I like, however I cannot identify what the x-axis represents. I have looked extensively in the documentation, looked at all properties of Mab (it is close to 150 on the x-axis, so I hoped to identify a property by it being close to 150 in value), tried sorting the list before plotting and did some Google searches. Can anyone help identifying what that axis means? Thanks in advance.
The code is: moons = PlanetaryMoonData[All, "Diameter", "EntityAssociation"]; ListLogPlot[moons, AxesLabel -> Automatic]
Result: