I want to print a Graphics with a given absolute width and height in say, millimeters.
From the reference documentation of Graphics, I understand that in:
ImageSize->w
w is required in points or 1/72 inch. If w shall be in millimeters, hence I have to write:
ImageSize->360/127 w
But this does not work. It leads to a far smaller image when printed.
Can anybody tell me, how to specify options for drawing images with given real-world size? Or, even better, can someone point me to a description how WL deals with sizes of drawings, frames, panes, margins, padding, etc.?
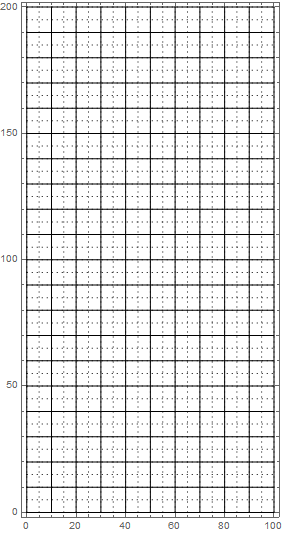
Here a small example that should draw a Graphics with absolute width w mm and height h mm. It has a raster of centimeter lines and dotted m-millimeter lines.
draw[w_, h_, m_: 1] :=
 Graphics[{Thin,
   (* draw mm-lines every m millimeters *)
   Dotted,
   Table[Line[{{x, 0}, {x, h}}], {x, 0, w, m}],
   Table[Line[{{0, y}, {w, y}}], {y, 0, h, m}],
   (* draw cm-lines *)
   Dashing[{}],
   Table[Line[{{x, 0}, {x, h}}], {x, 0, w, 10}],
   Table[Line[{{0, y}, {w, y}}], {y, 0, h, 10}]
   }, Frame -> True, ImageSize -> 360/127 w, AspectRatio -> h/w
  ]

Block[{g, tmp},
 g = draw[100, 200, 5];
 Print[g];
 Print[tmp = AbsoluteOptions[g, ImageSize], "\t",
  tmp = Quantity[Last[tmp[[1]]], "points"], "\t",
  UnitConvert[tmp, "millimeter"]]
 ]
{ImageSize->283.465} 283.465pt 100.mm
When I print those graphics on my HP LaserJet the raster is 64mm wide and 131mm high. I would expect that to be 100mm and 200mm. The surrounding frame is 67mm wide and 134mm high.


