A Computational Method to Predict X Ray Diffraction (XRD) Patterns
Background
Ever wondered how DNA's double helix structure was discovered? How drugs are investigated? Well, welcome to the world of X-ray diffraction! 13 Nobel prizes were awarded for developments involving this old but effective technique, in fields ranging from physics to medicine. But, how is it so effective?
XRD is a powerful technique employed in various domains of science to determine the chemical makeup and thereby physical properties of various structures. Each lattice structure has its own "XRD fingerprint" which keys scientists in to its chemical makeup. This fingerprint is characterized by peaks with different intensities at different angles. Here is a sample for a face-centered cubic copper lattice structure:
![Copper XRD pattern: From X-Ray Diffraction Studies of Copper Nanopowder (arXiv:1003.6068v1 [physics.gen-ph])](https://community.wolfram.com//c/portal/getImageAttachment?filename=copperrealxrd.png&userId=1725111)
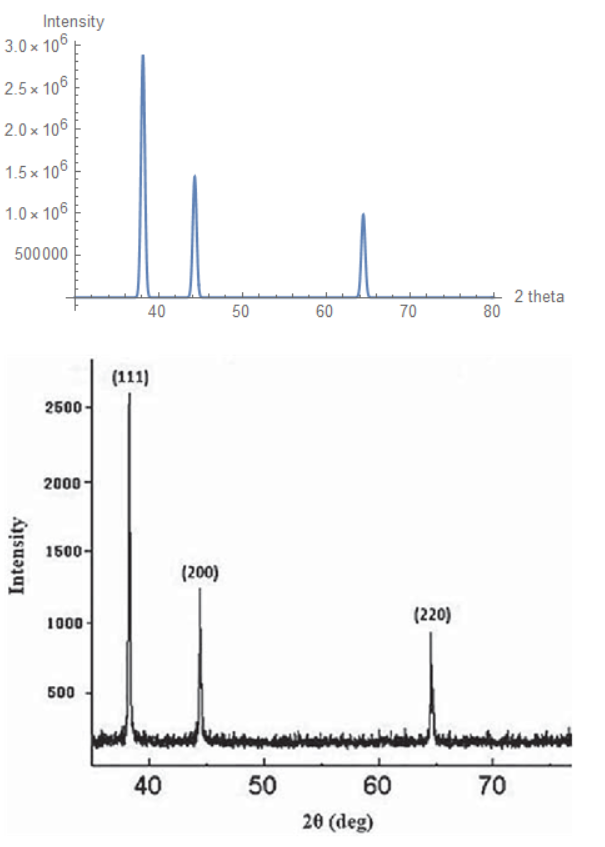
The first image in this post is a comparison of experimental and predicted results for a Silver crystal structure.
However, predicting these fingerprints given little experimental data is a mathematically involved procedure. This summer, as part of the Wolfram High School Summer Camp, I implemented a framework for predicting these fingerprints for various cubic lattice structures.
Creating the Program
Getting the Bragg Peak Positions
You might be wondering what the numbers on the top of the peaks mean. These numbers are Miller indices, which are descriptions of the planes in a unit cell that are producing the peaks. The first step is to use these planes to generate the Bragg peak positions:
$$d=\frac{a}{\sqrt{h^2+k^2+l^2}}$$ $$ \theta =2\arcsin{\left(\frac{\lambda}{2 d}\right)} $$
Here, $a$ denotes the lattice constant (length of a side in a cubic unit cell), $(h,k,l)$ denote the Miller indices, and $\lambda$ denotes the wavelength of the X-ray used. This is based on Bragg's law, see https://demonstrations.wolfram.com/BraggsLaw/ .
However, certain $(h,k,l)$ are forbidden in some structures. For example, in a body-centered cubic structure, $ h+k+l$ has to be even. The function PossiblePlanes accounts for these and has access to an extensive dataset of compounds and their structures.
To make coding easier, a list of associations was made with a certain $\theta$ being the key for a list of $hkl$ values.
grouped[elementlist_, n_] :=
 GroupBy[ PossiblePlanes[elementlist, n],
  1/Sqrt[(#[[1]]^2 + #[[2]]^2 + #[[3]]^2)] &]

association[elementlist_, n_, wavelength_] :=
 Sort[MapThread[#1 -> #2 &, {ToTheta[wavelength, elementlist, n],
    grouped[elementlist, n] // Values}]]
Atomic Form Factor
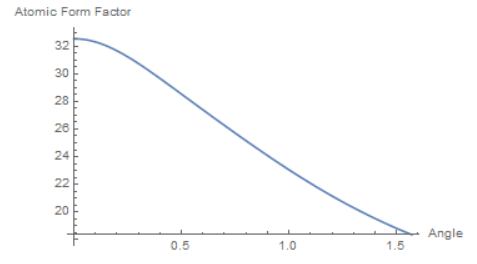
To account for different electron densities, atomic form factors were calculated using a dataset tabulated by the International Tables for Crystallography: http://it.iucr.org/Cb/ch6o1v0001/. These form factors vary by angle; shown below is copper: 
These atomic form factors are then used in the structure factor calculation, which is directly proportional to the square root of intensity. For unary systems, the structure factor calculation is relatively easy. For binary systems, however, the parity of the Miller indices must be taken into account.
evenodd[b_, elementlist_, theta_, w_] :=
 If[b, Total[atomdata[#, theta, w] & /@ elementlist],
  Differences[atomdata[#, theta, w] & /@ elementlist] // First]
Here, atomdata gives the atomic form factor at a specific point. This function is mapped to a set of True/False (Even or not) values and returns the structure factor. For a face-centered cubic cell, if the parity of $hkl$ is even, then the atomic form factors are summed, but if the parity is odd, the atomic form factors are subtracted.
Multiplicities
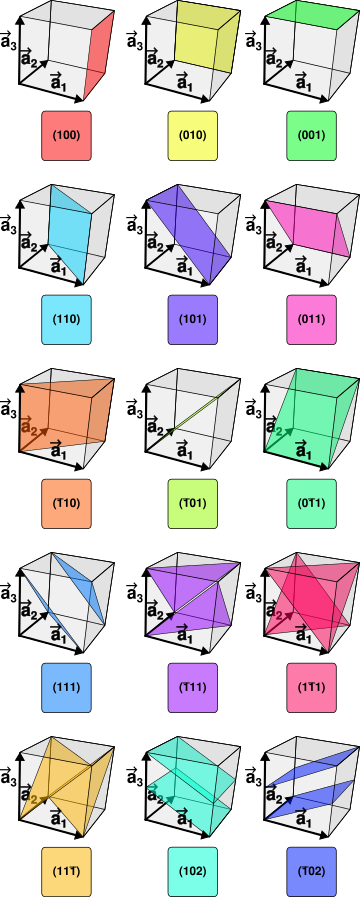
Now, back to the Miller indices. Take a look at the following graphic:

You might notice that if we reflect $(100)$ we can get $(010)$ and $(001)$ . We can also get negative indices, usually denoted $\overline{1}$ instead of $-1$. This gives us 6 total planes that are symmetry-equivalent, and correspond to the same peak. Hence, we say that the class of Miller indices $(h00)$ has a multiplicity of 6. These multiplicities range from 6 to 48 for a cubic lattice structure, but can get as low as 2 with less symmetric structures.
Therefore, instead of calculating the contributed intensity of each plane, we count them as one plane and multiply the resultant intensity by a specific multiplicity. This multiplicity is then used to calculate peak intensity.
Intensity Calculation
$$I_{hkl}=\underbrace{\frac{1+\cos^2 (2\theta)}{\sin^2(\theta)}}_{\text{Lorentz Polarization Correction}} \times \ \ \ \ \ \text{Multiplicity}_{hkl} \ \ \ \times \underbrace{F_{hkl}^2}_{\text{Structure Factor}}$$
The Lorentz polarization correction was introduced to improve accuracy and match experimental conditions as X-rays will not be completely polarized at every angle.
intensity[w_, elementlist_, n_] :=
 Transpose@{(association[Flatten @ elementlist, n, w] //
     Keys), (.5 (1 + (Cos[#])^2)/(Sin[#/2]^2 *
           Cos[#/2])) & /@ (association[Flatten @ elementlist, n, w] //
        Keys) *
    (multiplicity /@ (Last /@ (association[Flatten @ elementlist, n,
           w] // Values)))*(structurefactor[elementlist,
       w, (association[Flatten @ elementlist, n, w])]) ^2 }
intensity gives a list of Bragg peak positions and their respective intensities using the aforementioned formula. This intensity function is then inputed in a function which finally plots the diffraction pattern.
peak[{theta_, intensity_}] :=
 intensity * Exp[-10000 Pi (t - theta)^2]
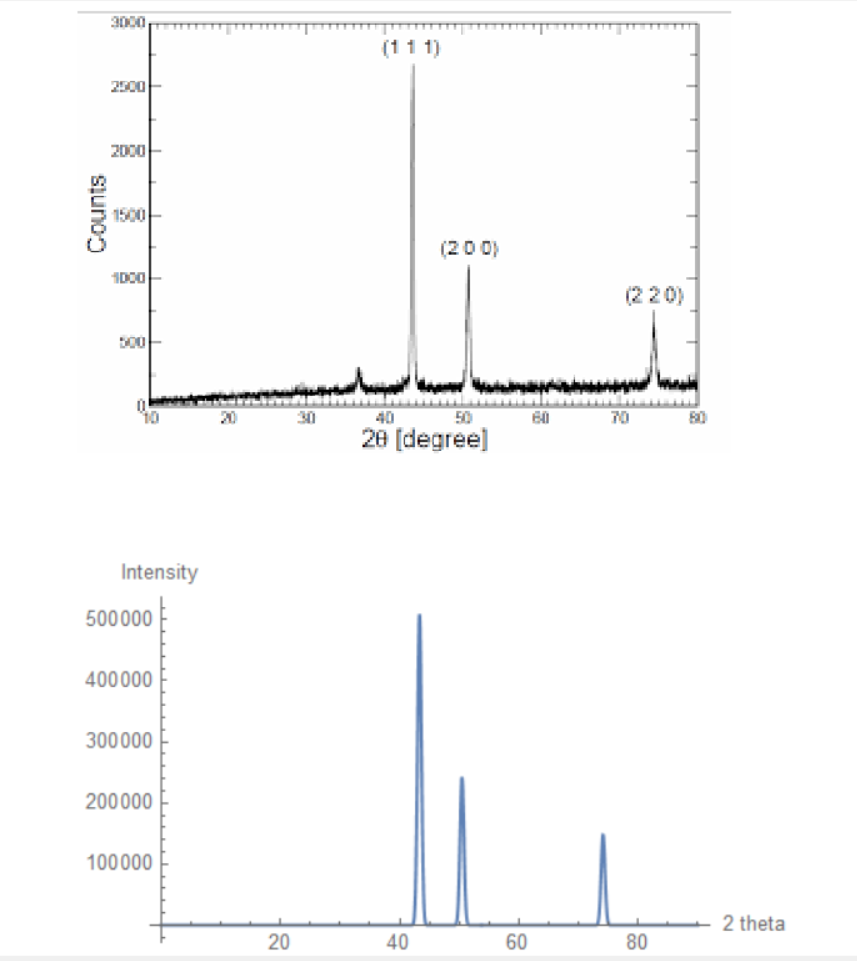
Where $t$ is the variable to be plotted against. Here is a comparison of the predicted XRD pattern vs the real diffracted pattern for a Copper FCC structure:

The absolute intensities have little use, as relative intensities are primarily used to analyze these patterns.
Future Research
For future research, I have many ideas I want to implement. Thanks to Mr. Wolfram, I certainly have a lot to do this summer! Perhaps the most ambitious of my future plans is doing the inverse problem: predicting the lattice structure from a given XRD pattern.
Acknowledgements
I would like to thank my mentor, Eryn Gillam, for helping me throughout my project. I would also like to thank the other mentors for their help, and Mohammad Bahrami for his lectures. Wolfram Summer Camp truly gave me an outlet to express my creativity in novel ways, and the two weeks I spent here were invaluable. Wolfram Summer Camp gave me a novel perspective on how to approach all aspects of life, and key insight into how computational thinking can change the world. For these reasons and more, I am beyond grateful to have been a part of this camp, and am looking forward to apply my new skills.
Computational Essay
https://github.com/hamza314/WSS-Template/blob/master/Final%20Project/Final%20Submission/Hamza%20Alsamraee%20WSC19.nb
 Attachments: