Recently I updated my Bayesian inference reporitory with a new function called BayesianLinearRegression to provide a Bayesian alternative to Mathematica's LinearModelFit. I also submitted the code for this function to the Wolfram function repository to make it easier to access, so the function can also be used with ResourceFunction["BayesianLinearRegression"].
The example notebook in the repository provides several examples of how the function can be used, some of which I will reproduce below. Please refer to the GitHub README.md file (which is displayed on the homepage of the repository) for instructions about installing the BayesianInference package. The code is in this file, in case you're interested in taking a look under the hood.
Fitting polynomials
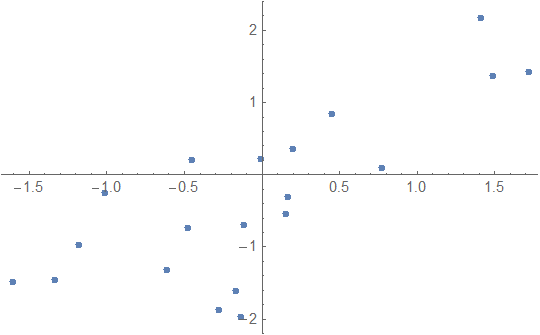
First generate some test data:
data = RandomVariate[
  MultinormalDistribution[{{1, 0.7}, {0.7, 1}}],
  20
];
ListPlot[data]
The usage of BayesianLinearRegression is similar to that of LinearModelFit with one significant difference: I decided that the Rule-based data specification used by Predict and NetTrain is often more convenient than the matrix input used by the Fit family, so I decided that both types of data specifications should work. The main reason for this is that BayesianLinearRegression also supports regression of vector outputs (an example of that is given in the repository example notebook), in which case the Rule-based format is often easier to understand.
When you fit a model, BayesianLinearRegression returns an Association containing all relevant information about the fit. Fit a model of the form y == a + b x + randomness where randomness is distributed as NormalDistribution[0, sigma]. Here, a, b and sigma are unknowns that need to be fitted to the data:
In[20]:= Clear[x];
model =  BayesianLinearRegression[data, {1, x}, x];
Below is a more detailed description of the information return by BayesianLinearRegression, but let's first concentrate on the main fit result, which is the posterior predictive distribution :
In[61]:= model["Posterior", "PredictiveDistribution"]

Out[61]= StudentTDistribution[-0.267818 + 0.986121 x,
 0.726105 Sqrt[1.05016 + 0.00692863 x + 0.0635094 x^2],
 2001/100
]
As you can see, the result is returned is an x-dependent StudentTDistribution. Visualize the predictions:
With[{
  predictiveDist = model["Posterior", "PredictiveDistribution"],
  bands = {95, 50, 5}
  },
 Show[
  Plot[
   Evaluate@InverseCDF[predictiveDist, bands/100],
   {x, -4, 4}, Filling -> {1 -> {2}, 3 -> {2}}, PlotLegends -> bands
   ],
  ListPlot[data],
  PlotRange -> All
  ]
 ]
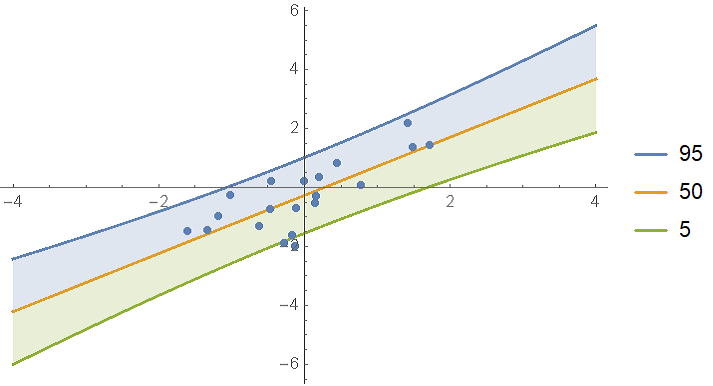
In the BayesianInference package on GitHub, I included a function called regressionPlot1D which makes it a bit easier to make this plot:
Show[
 regressionPlot1D[model["Posterior", "PredictiveDistribution"], {x, -4, 4}, {95, 50, 5}],
 ListPlot[data]
]
(* same result*)
Model comparison and model mixing
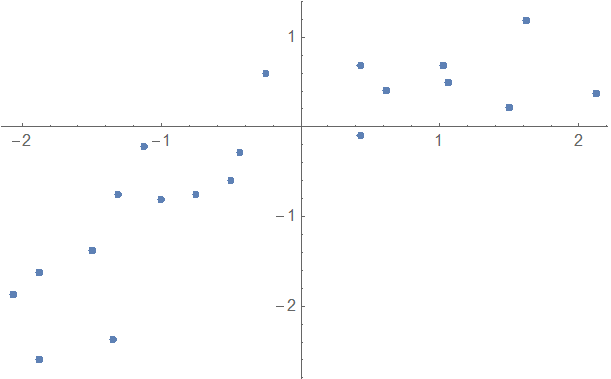
Often you'll want to compare multiple models against a data set to see which one works best. For example, here is some data where it's a bit unclear if you should use a first or second order model:
data = {{-1.5`,-1.375`},{-1.34375`,-2.375`},{1.5`,0.21875`},{1.03125`,0.6875`},{-0.5`,-0.59375`},
  {-1.875`,-2.59375`},{1.625`,1.1875`},{-2.0625`,-1.875`},{1.0625`,0.5`},{-0.4375`,-0.28125`},{-0.75`,-0.75`},{2.125`,0.375`},{0.4375`,0.6875`},{-1.3125`,-0.75`},{-1.125`,-0.21875`},
  {0.625`,0.40625`},{-0.25`,0.59375`},{-1.875`,-1.625`},{-1.`,-0.8125`},{0.4375`,-0.09375`}}
ListPlot[data]
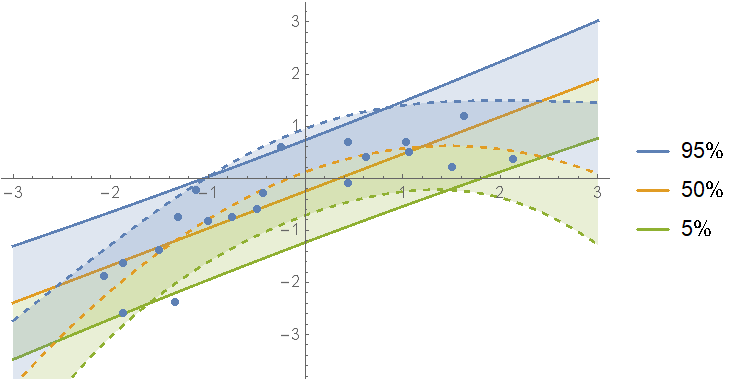
Fit the data with polynomials up to fourth degree; rank the log-evidences and inspect them. As you can see, the first and second order fits are almost equally likely:
In[152]:= models = AssociationMap[
   BayesianLinearRegression[Rule @@@ data, x^Range[0, #], x] &,
   Range[0, 4]
   ];
ReverseSort@models[[All, "LogEvidence"]]

Out[153]= <|1 -> -30.0072, 2 -> -30.1774, 3 -> -34.4292, 4 -> -38.7037, 0 -> -38.787|>
Show the prediction bands:
Show[
 regressionPlot1D[ models[1, "Posterior", "PredictiveDistribution"], {x, -3, 3}],
 regressionPlot1D[models[2, "Posterior", "PredictiveDistribution"], {x, -3, 3},  PlotStyle -> Dashed, PlotLegends -> None],
 ListPlot[data]
]
Instead of picking just one of the models, we can define a mixture over all of them. First calculate the weights for each fit:
In[94]:= weights = Normalize[
   (* subtract the max to reduce rounding error *)
   Exp[models[[All, "LogEvidence"]] - Max[models[[All, "LogEvidence"]]]],
   Total
   ];
ReverseSort[weights]

Out[95]= <|1 -> 0.516002, 2 -> 0.47702, 3 -> 0.0068122, 4 -> 0.0000982526,
 0 -> 0.0000667854|>
Define a mixture of posterior predictive distributions and show the predictions:
In[96]:= mixDist = MixtureDistribution[
   Values[weights],
   Values@models[[All, "Posterior", "PredictiveDistribution"]]
   ];
Show[
 regressionPlot1D[mixDist, {x, -3, 3}],
 ListPlot[data]
 ]
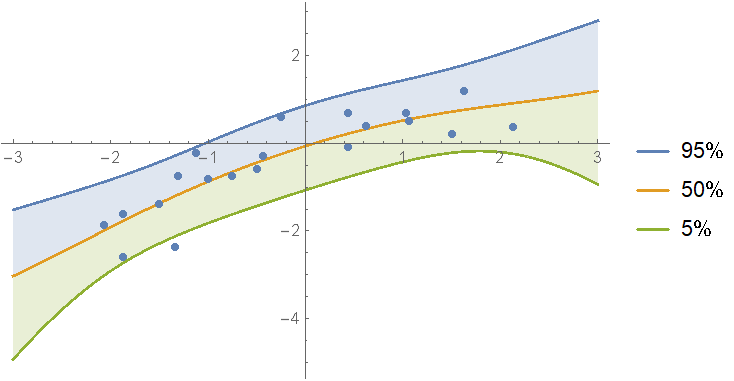
As you can see, if one model is not clearly the best, you can just split the difference between them.
Another interesting thing you can do with BayesianLinearRegression is Bayesian updating. Basically, this means that if you've fitted some data in the past and are now finding new data, you can incorporate the new data by updating your fit without having to re-fit all of the data (old and new) in one go. An example of this is given in the example code notebook on GitHub (in the section about the "PriorParameters" options of the function).
Detailed explanation about the returned values
BayesianLinearRegression returns an Association with the following keys:
Keys[model]

Out[21]= {"LogEvidence", "PriorParameters", "PosteriorParameters", "Posterior", "Prior", "Basis", "IndependentVariables"}
"LogEvidence": In a Bayesian setting, the evidence (also called marginal likelihood) measures how well the model fits the data (with a higher evidence indicating a better fit). The evidence has the virtue that it naturally penalizes models for their complexity and therefore does not suffer from over-fitting in the way that measures like the sum-of-squares or likelihood do."Basis", "IndependentVariables": Simply the basis functions and independent variable specified by the user."Posterior", "Prior": These two keys each hold an association with 4 distributions:
"PredictiveDistribution": A distribution that depends on the independent variables (x in the example above). By filling in a value for x, you get a distribution that tells you where you could expect to find future y values. This distribution accounts for all relevant uncertainties in the model: model variance caused by the term randomness; uncertainty in the values of a and b; and uncertainty in sigma."UnderlyingValueDistribution": Similar to "PredictiveDistribution", but this distribution give the possible values of a + b x without the randomness error term."RegressionCoefficientDistribution": The join distribution over a and b."ErrorDistribution": The distribution of the variance sigma^2.
"PriorParameters", "PosteriorParameters": These parameters are not immediately important most of the time, but they contain all of the relevant information about the fit.
Sources
The formulas underlying BayesianLinearRegression are based mainly on the following Wikipedia articles. The names of the hyper parameters returned by the function are based on the article about multivariate linear regression.