Message Boards Message Boards

Finding all structural breaks in time series

Posted 5 years ago

Introduction

In this document we show how to find the so called "structural breaks", [Wk1], in a given time series. The algorithm is based in on a systematic application of Chow Test, [Wk2], combined with an algorithm for local extrema finding in noisy time series, [AA1].

The algorithm implementation is based on the packages "MonadicQuantileRegression.m", [AAp1], and "MonadicStructuralBreaksFinder.m", [AAp2]. The package [AAp1] provides the software monad QRMon that allows rapid and concise specification of Quantile Regression workflows. The package [AAp2] extends QRMon with functionalities related to structural breaks finding.

What is a structural break?

It looks like at least one type of "structural breaks" are defined through regression models, [Wk1]. Roughly speaking a structural break point of time series is a regressor point that splits the time series in such way that the obtained two parts have very different regression parameters.

One way to test such a point is to use Chow test, [Wk2]. From [Wk2] we have the definition:

The Chow test, proposed by econometrician Gregory Chow in 1960, is a test of whether the true coefficients in two linear regressions on different data sets are equal. In econometrics, it is most commonly used in time series analysis to test for the presence of a structural break at a period which can be assumed to be known a priori (for instance, a major historical event such as a war).

Example

Here is an example of the described algorithm application to the data from [Wk2].

QRMonUnit[data]?QRMonPlotStructuralBreakSplits[ImageSize -> Small];

IntroductionsExample

Load packages

Here we load the packages [AAp1] and [AAp2].

Import["https://raw.githubusercontent.com/antononcube/MathematicaForPrediction/master/MonadicProgramming/MonadicQuantileRegression.m"]
Import["https://raw.githubusercontent.com/antononcube/MathematicaForPrediction/master/MonadicProgramming/MonadicStructuralBreaksFinder.m"]

Data used

In this section we assign the data used in this document.

Illustration data from Wikipedia

Here is the data used in the Wikipedia article "Chow test", [Wk2].

data = {{0.08, 0.34}, {0.16, 0.55}, {0.24, 0.54}, {0.32, 0.77}, {0.4, 
    0.77}, {0.48, 1.2}, {0.56, 0.57}, {0.64, 1.3}, {0.72, 1.}, {0.8, 
    1.3}, {0.88, 1.2}, {0.96, 0.88}, {1., 1.2}, {1.1, 1.3}, {1.2, 
    1.3}, {1.3, 1.4}, {1.4, 1.5}, {1.4, 1.5}, {1.5, 1.5}, {1.6, 
    1.6}, {1.7, 1.1}, {1.8, 0.98}, {1.8, 1.1}, {1.9, 1.4}, {2., 
    1.3}, {2.1, 1.5}, {2.2, 1.3}, {2.2, 1.3}, {2.3, 1.2}, {2.4, 
    1.1}, {2.5, 1.1}, {2.6, 1.2}, {2.6, 1.4}, {2.7, 1.3}, {2.8, 
    1.6}, {2.9, 1.5}, {3., 1.4}, {3., 1.8}, {3.1, 1.4}, {3.2, 
    1.4}, {3.3, 1.4}, {3.4, 2.}, {3.4, 2.}, {3.5, 1.5}, {3.6, 
    1.8}, {3.7, 2.1}, {3.8, 1.6}, {3.8, 1.8}, {3.9, 1.9}, {4., 2.1}};
ListPlot[data]

DataUsedWk2

S&P 500 Index

Here we get the time series corresponding to S&P 500 Index.

tsSP500 = FinancialData[Entity["Financial", "^SPX"], {{2015, 1, 1}, Date[]}]
DateListPlot[tsSP500, ImageSize -> Medium]

DataUsedSP500

Application of Chow Test

The Chow Test statistic is implemented in [AAp1]. In this document we rely on the relative comparison of the Chow Test statistic values: the larger the value of the Chow test statistic, the more likely we have a structural break.

Here is how we can apply the Chow Test with a QRMon pipeline to the [Wk2] data given above.

chowStats =
  QRMonUnit[data]?
   QRMonChowTestStatistic[Range[1, 3, 0.05], {1, x}]?
   QRMonTakeValue;

We see that the regressor points $\text{$\$$Failed} $ and $1.7$ have the largest Chow Test statistic values.

Block[{chPoint = TakeLargestBy[chowStats, Part[#, 2]& , 1]}, 
ListPlot[{chowStats, chPoint}, Filling -> Axis, PlotLabel -> Row[{"Point with largest Chow Test statistic:", 
Spacer[8], chPoint}]]]

ApplicationOfChowTestchowStats

The first argument of QRMonChowTestStatistic is a list of regressor points or Automatic. The second argument is a list of functions to be used for the regressions.

Here is an example of an automatic values call.

chowStats2 = QRMonUnit[data]?QRMonChowTestStatistic?QRMonTakeValue;
ListPlot[chowStats2, GridLines -> {
Part[
Part[chowStats2, All, 1], 
OutlierIdentifiers`OutlierPosition[
Part[chowStats2, All, 2],  OutlierIdentifiers`SPLUSQuartileIdentifierParameters]], None}, GridLinesStyle -> Directive[{Orange, Dashed}], Filling -> Axis]

ApplicationOfChowTestchowStats2

For the set of values displayed above we can apply simple 1D outlier identification methods, [AAp3], to automatically find the structural break point.

chowStats2[[All, 1]][[OutlierPosition[chowStats2[[All, 2]], SPLUSQuartileIdentifierParameters]]]
(* {1.7} *)

OutlierPosition[chowStats2[[All, 2]], SPLUSQuartileIdentifierParameters]
(* {20} *)

We cannot use that approach for finding all structural breaks in the general time series cases though as exemplified with the following code using the time series S&P 500 Index.

chowStats3 = QRMonUnit[tsSP500]?QRMonChowTestStatistic?QRMonTakeValue;
DateListPlot[chowStats3, Joined -> False, Filling -> Axis]

ApplicationOfChowTestSP500

OutlierPosition[chowStats3[[All, 2]], SPLUSQuartileIdentifierParameters]
(* {} *)

OutlierPosition[chowStats3[[All, 2]], HampelIdentifierParameters]
(* {} *)

In the rest of the document we provide an algorithm that works for general time series.

Finding all structural break points

Consider the problem of finding of all structural breaks in a given time series. That can be done (reasonably well) with the following procedure.

  1. Chose functions for testing for structural breaks (usually linear.)

  2. Apply Chow Test over dense enough set of regressor points.

  3. Make a time series of the obtained Chow Test statistics.

  4. Find the local maxima of the Chow Test statistics time series.

  5. Determine the most significant break point.

  6. Plot the splits corresponding to the found structural breaks.

QRMon has a function, QRMonFindLocalExtrema, for finding local extrema; see [AAp1, AA1]. For the goal of finding all structural breaks, that semi-symbolic algorithm is the crucial part in the steps above.

Computation

Chose fitting functions

fitFuncs = {1, x};

Find Chow test statistics local maxima

The computation below combines steps 2,3, and 4.

qrObj =
  QRMonUnit[tsSP500]?
   QRMonFindChowTestLocalMaxima["Knots" -> 20, 
    "NearestWithOutliers" -> True, 
    "NumberOfProximityPoints" -> 5, "EchoPlots" -> True, 
    "DateListPlot" -> True, 
    ImageSize -> Medium]?
   QRMonEchoValue;

ComputationLocalMaxima

Find most significant structural break point

splitPoint = TakeLargestBy[qrObj?QRMonTakeValue, #[[2]] &, 1][[1, 1]]

Plot structural breaks splits and corresponding fittings

Here we just make the plots without showing them.

sbPlots =
  QRMonUnit[tsSP500]?
   QRMonPlotStructuralBreakSplits[(qrObj? QRMonTakeValue)[[All, 1]], 
    "LeftPartColor" -> Gray, "DateListPlot" -> True, 
    "Echo" -> False, 
    ImageSize -> Medium]?
   QRMonTakeValue;

The function QRMonPlotStructuralBreakSplits returns an association that has as keys paired split points and Chow Test statistics; the plots are association's values.

Here we tabulate the plots with plots with most significant breaks shown first.

Multicolumn[
 KeyValueMap[
  Show[#2, PlotLabel -> 
     Grid[{{"Point:", #1[[1]]}, {"Chow Test statistic:", #1[[2]]}}, Alignment -> Left]] &, KeySortBy[sbPlots, -#[[2]] &]], 2]

ComputationStructuralBreaksPlots

Future plans

We can further apply the algorithm explained above to identifying time series states or components. The structural break points are used as knots in appropriate Quantile Regression fitting. Here is an example.

The plan is to develop such an identifier of time series states in the near future. (And present it at WTC-2019.)

FuturePlansTimeSeriesStates

References

Articles

[Wk1] Wikipedia entry, Structural breaks.

[Wk2] Wikipedia entry, Chow test.

[AA1] Anton Antonov, "Finding local extrema in noisy data using Quantile Regression", (2019), MathematicaForPrediction at WordPress.

[AA2] Anton Antonov, "A monad for Quantile Regression workflows", (2018), MathematicaForPrediction at GitHub.

Packages

[AAp1] Anton Antonov, Monadic Quantile Regression Mathematica package, (2018), MathematicaForPrediction at GitHub.

[AAp2] Anton Antonov, Monadic Structural Breaks Finder Mathematica package, (2019), MathematicaForPrediction at GitHub.

[AAp3] Anton Antonov, Implementation of one dimensional outlier identifying algorithms in Mathematica, (2013), MathematicaForPrediction at GitHub.

Videos

[AAv1] Anton Antonov, Structural Breaks with QRMon, (2019), YouTube.

POSTED BY: Anton Antonov
25 Replies
POSTED BY: Anton Antonov
Posted 5 years ago

This is excellent! Your post solves my question in a long ago post.

POSTED BY: Jason Zhao

Dear Antonov,

I am very interested in learning structural breaks in the time series. I started to apply your package for the rainfall time series. Please see the enclosed notebook. I got an error. What can I do now?

I have 222 rain gauge stations over Turkey, so I should solve the error so I can analysis for other stations.

Thanks for your time.

Regards, Mohammad

Attachments:
POSTED BY: M.A. Ghorbani

I forgot to put the paclet installation command in the notebook -- I just updated it. Please, use that one.

POSTED BY: Anton Antonov

Thank you for your note!

You might want to follow this dedicated MathematicaVsR project, in which I plan to discuss various algorithms and measures for finding anomalies in time series. (I plan to give a presentation at WTC-2019 on that subject.)

POSTED BY: Anton Antonov
POSTED BY: Moderation Team

Thank you, Staff Team!

POSTED BY: Anton Antonov

Thanks for trying out that package!

The error message you got:

MonadicQuantileRegressionPrivateChowTestStatistic::empdata: The split point 1.` produced an empty split dataset.

indicates what is the problem: you are using the min x-value as splitting point. If you use splitting points away from min and max x-values the computations proceed normally; see the attached screenshot.

enter image description here

POSTED BY: Anton Antonov

I appreciate your help.

I improved the command as you, but I got an error again:( What is the problem?

Attachments:
POSTED BY: M.A. Ghorbani

It looks like you are using an older version of Mathematica, not the current one, Version 12.0. What is your Mathematica version?

Fit in Mathematica 12.0 can take 4 arguments: see the attached screenshot.

enter image description here

POSTED BY: Anton Antonov

You right. I have a version 11.1.

Indeed I wanted to invite you to this study as a collaborative study and apply your package for the 222 stations record. It was an honor to me if I had this opportunity.

Thank you so much for everything. Mohammad

POSTED BY: M.A. Ghorbani

I changed the implementation to work with older Mathematica versions -- please try it out.

POSTED BY: Anton Antonov

Where is it?

You forgot to attach the older version.

POSTED BY: M.A. Ghorbani

Just use GitHub implementations. (Through the Import commands in your notebooks.)

POSTED BY: Anton Antonov

Hi, Thanks to Dr. Antonov, I can't find the youtube video of the definition of this structural break?

POSTED BY: Nasrin Attar
Posted 4 years ago

how can I get structure break by time-series data of river runoff? which software should I use to get a structured break?

POSTED BY: Murtaza Dar
POSTED BY: Anton Antonov
Posted 4 months ago

Hi Anton,

Thank you for sharing the excellent package. How do I determine the year of the breaking point? I am a beginner in Mathematica. sorry.

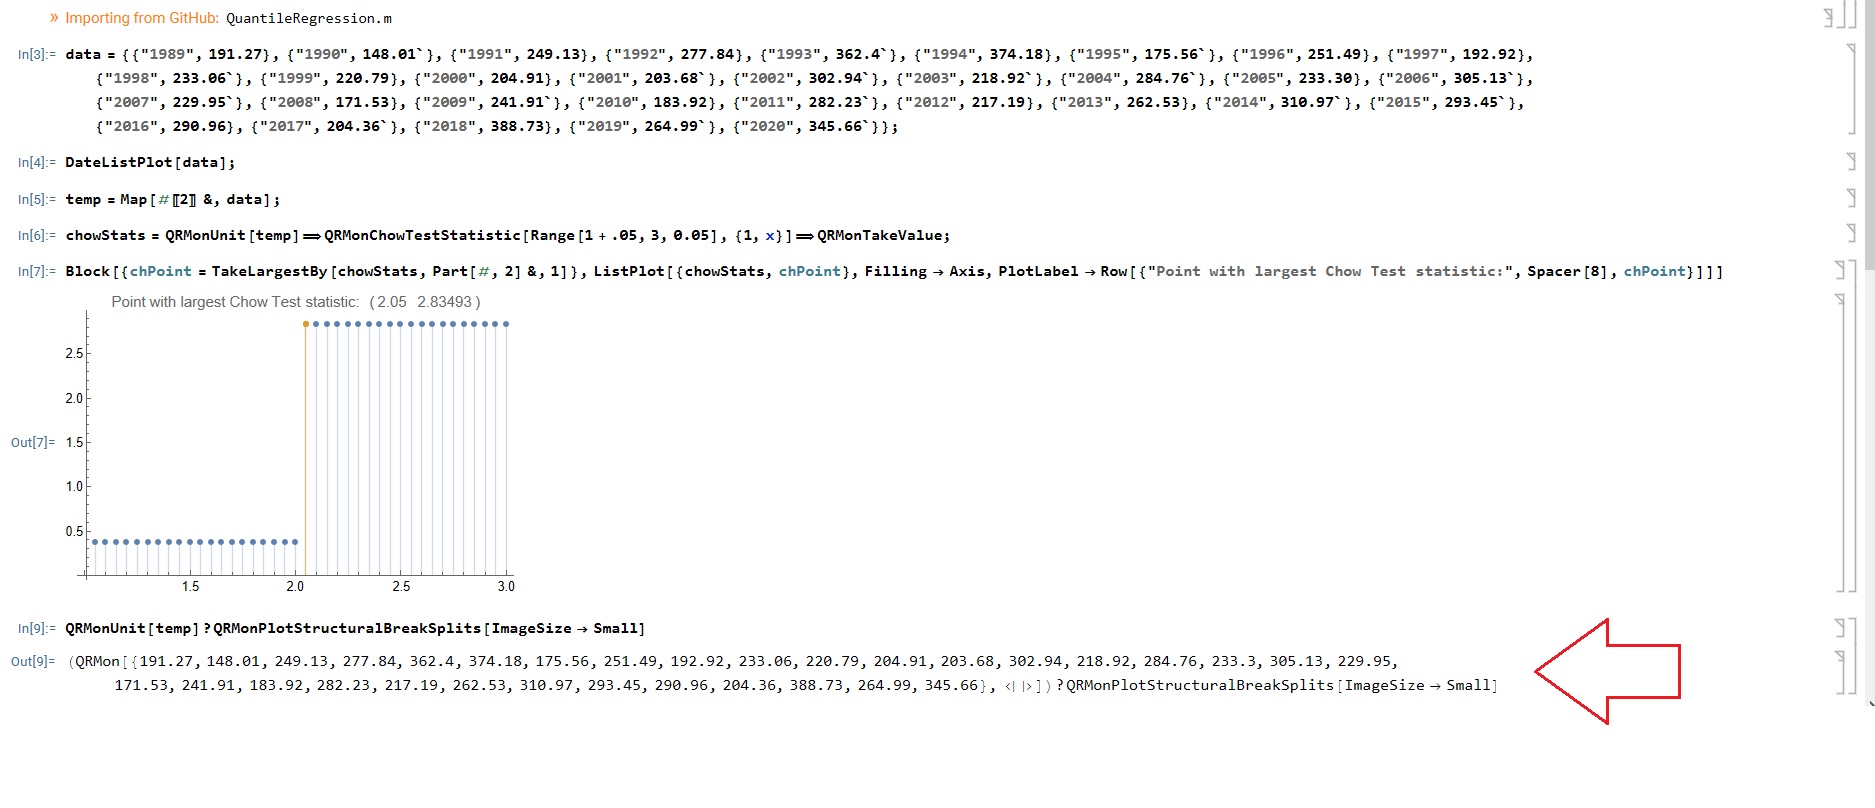
data = {{"1989", 191.27}, {"1990", 148.01`}, {"1991", 
   249.13}, {"1992", 277.84}, {"1993", 362.4`}, {"1994", 
   374.18}, {"1995", 175.56`}, {"1996", 251.49}, {"1997", 
   192.92}, {"1998", 233.06`}, {"1999", 220.79}, {"2000", 
   204.91}, {"2001", 203.68`}, {"2002", 302.94`}, {"2003", 
   218.92`}, {"2004", 284.76`}, {"2005", 233.30}, {"2006", 
   305.13`}, {"2007", 229.95`}, {"2008", 171.53}, {"2009", 
   241.91`}, {"2010", 183.92}, {"2011", 282.23`}, {"2012", 
   217.19}, {"2013", 262.53}, {"2014", 310.97`}, {"2015", 
   293.45`}, {"2016", 290.96}, {"2017", 204.36`}, {"2018", 
   388.73}, {"2019", 264.99`}, {"2020", 345.66`}}

enter image description here

POSTED BY: Alex Teymouri

Thanks for trying out those functionalities!

Please make sure:

  • All data elements are numeric
  • Correct syntax pipeline symbol is used between the monadic operations : "⇒" instead of "?"

Remark: Apparently there is a "bug" in the post itself -- it shows code with "?" instead of "⇒".

See the attached notebook.

Attachments:
POSTED BY: Anton Antonov
Posted 4 months ago

Thank you so much, Anton.

I never forget your help.

POSTED BY: Alex Teymouri
Posted 1 month ago

Hello, Dr. Antonov, have a good day. I have done your package for monthly wind speed temporal data (period 2000-2023), please let me know your opinion on its accuracy

Attachments:
POSTED BY: Erfan Abdi

Thank you for your interest in this paclet!

What is the interpretation of the time axis -- weeks, days? The time-values are uniform -- are they "just" observation indexes?

I think too many knots are used. (In the attached notebook you provided.) I think the knots should be [20,25].

Also, if we look into the regression quantiles fits:

qrObj2 =
  QRMonUnit[data]⟹
   QRMonEchoDataSummary⟹
   QRMonQuantileRegression[20, {0.1, 0.5, 0.9}, InterpolationOrder -> 2]⟹
   QRMonPlot[ImageSize -> Large, AspectRatio -> 1/3, GridLines -> {{170, 200, 240, 255}, None}];

maybe the structural breaks are just at {170, 200, 240, 255}.

enter image description here

POSTED BY: Anton Antonov
Posted 1 month ago

Thank you very much. My time axis is months (288 months from 2000 to 2023). How can I modify the following command to show (170, 200, 240, 255) in the Chow diagram as shown below?

enter image description here

enter image description here

POSTED BY: Erfan Abdi

I will have time to take a look after two days. (Sorry for the delay...)

POSTED BY: Anton Antonov
Posted 1 month ago

Thanks for your time and waiting for your reply

POSTED BY: Erfan Abdi
Reply to this discussion
Community posts can be styled and formatted using the Markdown syntax.
Reply Preview
Attachments
Remove
or Discard

Group Abstract Group Abstract