Introduction
In this document we show how to find the so called "structural breaks", [Wk1], in a given time series. The algorithm is based in on a systematic application of Chow Test, [Wk2], combined with an algorithm for local extrema finding in noisy time series, [AA1].
The algorithm implementation is based on the packages "MonadicQuantileRegression.m", [AAp1], and "MonadicStructuralBreaksFinder.m", [AAp2]. The package [AAp1] provides the software monad QRMon that allows rapid and concise specification of Quantile Regression workflows. The package [AAp2] extends QRMon with functionalities related to structural breaks finding.
What is a structural break?
It looks like at least one type of "structural breaks" are defined through regression models, [Wk1]. Roughly speaking a structural break point of time series is a regressor point that splits the time series in such way that the obtained two parts have very different regression parameters.
One way to test such a point is to use Chow test, [Wk2]. From [Wk2] we have the definition:
The Chow test, proposed by econometrician Gregory Chow in 1960, is a test of whether the true coefficients in two linear regressions on different data sets are equal. In econometrics, it is most commonly used in time series analysis to test for the presence of a structural break at a period which can be assumed to be known a priori (for instance, a major historical event such as a war).
Example
Here is an example of the described algorithm application to the data from [Wk2].
QRMonUnit[data]?QRMonPlotStructuralBreakSplits[ImageSize -> Small];

Load packages
Here we load the packages [AAp1] and [AAp2].
Import["https://raw.githubusercontent.com/antononcube/MathematicaForPrediction/master/MonadicProgramming/MonadicQuantileRegression.m"]
Import["https://raw.githubusercontent.com/antononcube/MathematicaForPrediction/master/MonadicProgramming/MonadicStructuralBreaksFinder.m"]
Data used
In this section we assign the data used in this document.
Illustration data from Wikipedia
Here is the data used in the Wikipedia article "Chow test", [Wk2].
data = {{0.08, 0.34}, {0.16, 0.55}, {0.24, 0.54}, {0.32, 0.77}, {0.4,
    0.77}, {0.48, 1.2}, {0.56, 0.57}, {0.64, 1.3}, {0.72, 1.}, {0.8,
    1.3}, {0.88, 1.2}, {0.96, 0.88}, {1., 1.2}, {1.1, 1.3}, {1.2,
    1.3}, {1.3, 1.4}, {1.4, 1.5}, {1.4, 1.5}, {1.5, 1.5}, {1.6,
    1.6}, {1.7, 1.1}, {1.8, 0.98}, {1.8, 1.1}, {1.9, 1.4}, {2.,
    1.3}, {2.1, 1.5}, {2.2, 1.3}, {2.2, 1.3}, {2.3, 1.2}, {2.4,
    1.1}, {2.5, 1.1}, {2.6, 1.2}, {2.6, 1.4}, {2.7, 1.3}, {2.8,
    1.6}, {2.9, 1.5}, {3., 1.4}, {3., 1.8}, {3.1, 1.4}, {3.2,
    1.4}, {3.3, 1.4}, {3.4, 2.}, {3.4, 2.}, {3.5, 1.5}, {3.6,
    1.8}, {3.7, 2.1}, {3.8, 1.6}, {3.8, 1.8}, {3.9, 1.9}, {4., 2.1}};
ListPlot[data]

S&P 500 Index
Here we get the time series corresponding to S&P 500 Index.
tsSP500 = FinancialData[Entity["Financial", "^SPX"], {{2015, 1, 1}, Date[]}]
DateListPlot[tsSP500, ImageSize -> Medium]

Application of Chow Test
The Chow Test statistic is implemented in [AAp1]. In this document we rely on the relative comparison of the Chow Test statistic values: the larger the value of the Chow test statistic, the more likely we have a structural break.
Here is how we can apply the Chow Test with a QRMon pipeline to the [Wk2] data given above.
chowStats =
  QRMonUnit[data]?
   QRMonChowTestStatistic[Range[1, 3, 0.05], {1, x}]?
   QRMonTakeValue;
We see that the regressor points $\text{$\$$Failed} $ and $1.7$ have the largest Chow Test statistic values.
Block[{chPoint = TakeLargestBy[chowStats, Part[#, 2]& , 1]},
ListPlot[{chowStats, chPoint}, Filling -> Axis, PlotLabel -> Row[{"Point with largest Chow Test statistic:",
Spacer[8], chPoint}]]]

The first argument of QRMonChowTestStatistic is a list of regressor points or Automatic. The second argument is a list of functions to be used for the regressions.
Here is an example of an automatic values call.
chowStats2 = QRMonUnit[data]?QRMonChowTestStatistic?QRMonTakeValue;
ListPlot[chowStats2, GridLines -> {
Part[
Part[chowStats2, All, 1],
OutlierIdentifiers`OutlierPosition[
Part[chowStats2, All, 2],  OutlierIdentifiers`SPLUSQuartileIdentifierParameters]], None}, GridLinesStyle -> Directive[{Orange, Dashed}], Filling -> Axis]
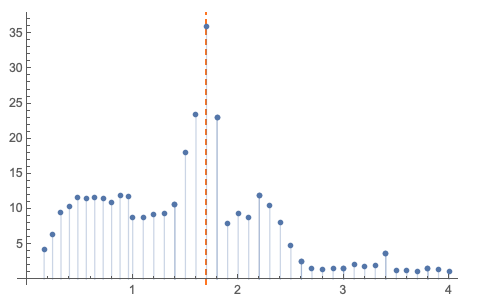
For the set of values displayed above we can apply simple 1D outlier identification methods, [AAp3], to automatically find the structural break point.
chowStats2[[All, 1]][[OutlierPosition[chowStats2[[All, 2]], SPLUSQuartileIdentifierParameters]]]
(* {1.7} *)

OutlierPosition[chowStats2[[All, 2]], SPLUSQuartileIdentifierParameters]
(* {20} *)
We cannot use that approach for finding all structural breaks in the general time series cases though as exemplified with the following code using the time series S&P 500 Index.
chowStats3 = QRMonUnit[tsSP500]?QRMonChowTestStatistic?QRMonTakeValue;
DateListPlot[chowStats3, Joined -> False, Filling -> Axis]

OutlierPosition[chowStats3[[All, 2]], SPLUSQuartileIdentifierParameters]
(* {} *)

OutlierPosition[chowStats3[[All, 2]], HampelIdentifierParameters]
(* {} *)
In the rest of the document we provide an algorithm that works for general time series.
Finding all structural break points
Consider the problem of finding of all structural breaks in a given time series. That can be done (reasonably well) with the following procedure.
Chose functions for testing for structural breaks (usually linear.)
Apply Chow Test over dense enough set of regressor points.
Make a time series of the obtained Chow Test statistics.
Find the local maxima of the Chow Test statistics time series.
Determine the most significant break point.
Plot the splits corresponding to the found structural breaks.
QRMon has a function, QRMonFindLocalExtrema, for finding local extrema; see [AAp1, AA1]. For the goal of finding all structural breaks, that semi-symbolic algorithm is the crucial part in the steps above.
Computation
Chose fitting functions
fitFuncs = {1, x};
Find Chow test statistics local maxima
The computation below combines steps 2,3, and 4.
qrObj =
  QRMonUnit[tsSP500]?
   QRMonFindChowTestLocalMaxima["Knots" -> 20,
    "NearestWithOutliers" -> True,
    "NumberOfProximityPoints" -> 5, "EchoPlots" -> True,
    "DateListPlot" -> True,
    ImageSize -> Medium]?
   QRMonEchoValue;

Find most significant structural break point
splitPoint = TakeLargestBy[qrObj?QRMonTakeValue, #[[2]] &, 1][[1, 1]]
Plot structural breaks splits and corresponding fittings
Here we just make the plots without showing them.
sbPlots =
  QRMonUnit[tsSP500]?
   QRMonPlotStructuralBreakSplits[(qrObj? QRMonTakeValue)[[All, 1]],
    "LeftPartColor" -> Gray, "DateListPlot" -> True,
    "Echo" -> False,
    ImageSize -> Medium]?
   QRMonTakeValue;
The function QRMonPlotStructuralBreakSplits returns an association that has as keys paired split points and Chow Test statistics; the plots are association's values.
Here we tabulate the plots with plots with most significant breaks shown first.
Multicolumn[
 KeyValueMap[
  Show[#2, PlotLabel ->
     Grid[{{"Point:", #1[[1]]}, {"Chow Test statistic:", #1[[2]]}}, Alignment -> Left]] &, KeySortBy[sbPlots, -#[[2]] &]], 2]

Future plans
We can further apply the algorithm explained above to identifying time series states or components. The structural break points are used as knots in appropriate Quantile Regression fitting. Here is an example.
The plan is to develop such an identifier of time series states in the near future. (And present it at WTC-2019.)

References
Articles
[Wk1] Wikipedia entry, Structural breaks.
[Wk2] Wikipedia entry, Chow test.
[AA1] Anton Antonov, "Finding local extrema in noisy data using Quantile Regression", (2019), MathematicaForPrediction at WordPress.
[AA2] Anton Antonov, "A monad for Quantile Regression workflows", (2018), MathematicaForPrediction at GitHub.
Packages
[AAp1] Anton Antonov, Monadic Quantile Regression Mathematica package, (2018), MathematicaForPrediction at GitHub.
[AAp2] Anton Antonov, Monadic Structural Breaks Finder Mathematica package, (2019), MathematicaForPrediction at GitHub.
[AAp3] Anton Antonov, Implementation of one dimensional outlier identifying algorithms in Mathematica, (2013), MathematicaForPrediction at GitHub.
Videos
[AAv1] Anton Antonov, Structural Breaks with QRMon, (2019), YouTube.


