Do you remember when a friend showed you how to cut a snowflake from a paper? Perhaps your family does it to decorate and celebrate holidays with this simple but artistic activity. I thought, why not to make something like this in form of an app? We then can use this custom-tailored art for an e-card, holiday blog post or whatever your imagination tells you.
We already have quite a few
snowflake related Demonstrations, for example
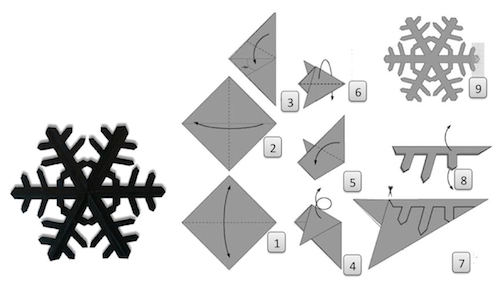
Parametric Snowflake Design. But I wanted something to imitate the actual process of cutting a snowflake from a sheet of paper see images below. First thing to remember is that we first fold paper up to the 12th part a slice of 30 degrees span. Then we cut it artistically and unfold to see the effect of cutting.

As we will deal with very different medium, it will bring some new features to the process. For instance:
1) One cannot undo cutting out a piece of paper, while interactively we can
2) We can see effect of molding 12th part reflected on the whole design immediately
3) Overlapping slices wider then 30 degrees would be hard with paper
4) We can infinitely and arbitrary sophisticate the process due to flexibility of programing language
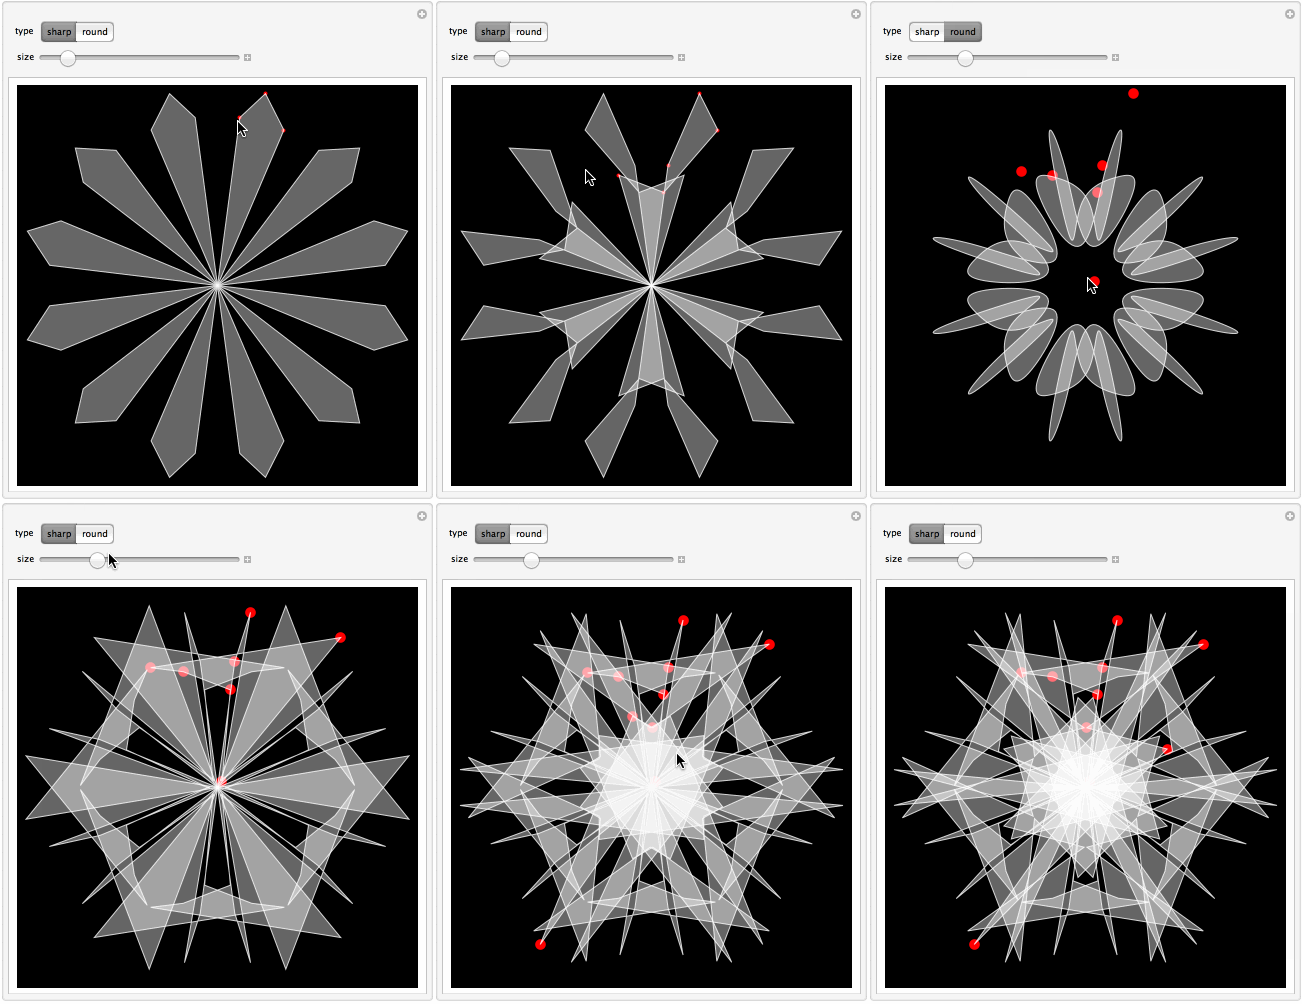
So without further ado below is an animation of how the snowflake designer works and below is the code, which is pretty short.

Manipulate[
Graphics[{
{PointSize[size], Red, Point[pt]},
GeometricTransformation[
{#, GeometricTransformation[#, ReflectionTransform[{1, 0}]]} &@
{EdgeForm[Directive[White, Opacity[.8]]],
FaceForm[Directive[White, Opacity[.4]]],
type[Join[{{0, 0}}, pt]]},
Table[RotationTransform[a], {a, 0, 2 Pi - Pi/3, Pi/3}]],
}, Background -> Black, ImageSize -> 400 {1, 1}],
{{type, Polygon}, {Polygon -> "sharp", spline -> "round"}},
{{size, .01}, 0, .1},
{{pt, {{0, 1}, {1/4, 1}, {1/2, 1}}}, Locator, Appearance -> None, LocatorAutoCreate -> True},
FrameMargins -> 0, Initialization -> (
spline[pt_] := FilledCurve[BSplineCurve[pt, SplineClosed -> True]])]
To add or remove locator
command+click on
Mac and
control+click on
Windows.
The app is based on controlling the shape of a 12th part with help of locators. The resulting shape is immediately reflected to form a 6th part, which is then further rotated 5 times to complete the whole snowflake. Reflections and rotations are made with help of GeometricTransformation function. One can choose sharp polygons or smooth spline curves. Of course the
real snowflakes do not grow like this, but it does resemble the way we toy with scissors and paper. Why do we need 12th part and not 6th, if snowflakes have hexagonal symmetry? Well this is because snowflakes has to be symmetric with respect to reflection between the left and right halves of each 6th part.
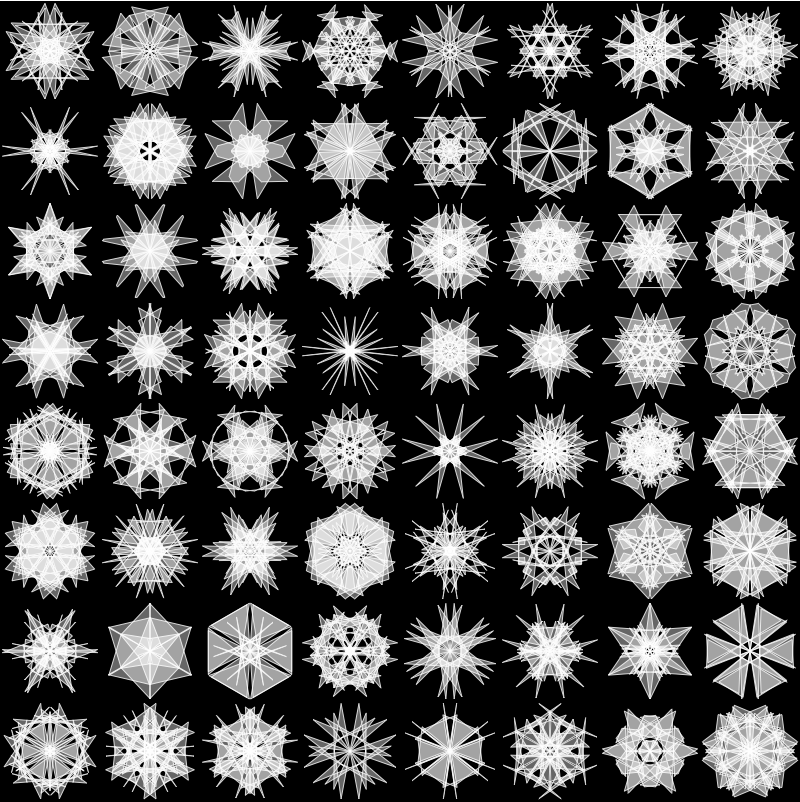
Instead of using GeometricTransformation to transform the shapes, we could use matrixes to transform sets of points and then build the single final shape out of the whole set of points. To demonstrate this I will write a short function and generate few random snowflakes so you can see what diversity of shapes can be achieved with the app above.
Enjoy! If you come up with some nice shapes get a screenshot and add them in comments to this post! Or let me know how we can improve this code. Also take a look how our sister Mathematica Stackexchange community
celebrates with snowflakes.
Happy holidays!
Vitaliy
snow[pt_] := Graphics[
{EdgeForm[Directive[White, Opacity[.8]]],
FaceForm[Directive[White, Opacity[.4]]],
Polygon[
Outer[#1.#2 &,
Table[RotationMatrix[a], {a, 0, 2 Pi - Pi/3, Pi/3}],
Join[Map[ReflectionMatrix[{1, 0}].# &, #], #] &@
Join[{{0, 0}}, pt],
1]]}
, Background -> Black, ImageSize -> 100 {1, 1}]
Grid[Partition[ParallelTable[
snow[RandomReal[{-1, 1}, {RandomInteger[{3, 9}], 2}]],
{64}], 8], Spacings -> {0, 0}]

And these are from modified code of the demonstration mentioned above -
Parametric Snowflake Design.
x1[a_, b_, c_, t_] := Sin[.5 t] - a Sin[b t]*Cos[t] - .1 c Sin[10 b t];
y1[a_, b_, c_, t_] := Cos[.5 t] - a Sin[b t]*Sin[t] - .1 c Cos[10 b t];
GraphicsGrid[Partition[ParallelTable[
With[{
a = RandomReal[{-1.5, 1.5}],
b = RandomInteger[{3, 15}],
c = RandomReal[{0, 1.5}],
clr1 = Black,
clr2 = RGBColor @@ RandomReal[1, 3],
clr3 = RGBColor @@ RandomReal[1, 3],
thick = RandomReal[{.04, .5}],
tm = 1},
ParametricPlot[
Evaluate[{{x1[a, b, c, t], y1[a, b, c, t]}, {x1[a, b, c, t],
y1[a, b, c, t]}}], {t, 0, tm 4 \[Pi]},
PlotStyle -> {{clr2, Thickness[0.001` + 0.05` thick]}, {clr3,
Thickness[0.001` + 0.01` thick]}}, Axes -> False,
PlotPoints -> 200, PlotRange -> All, Background -> clr1]]
, {n, 32}], 4], ImageSize -> 600]
