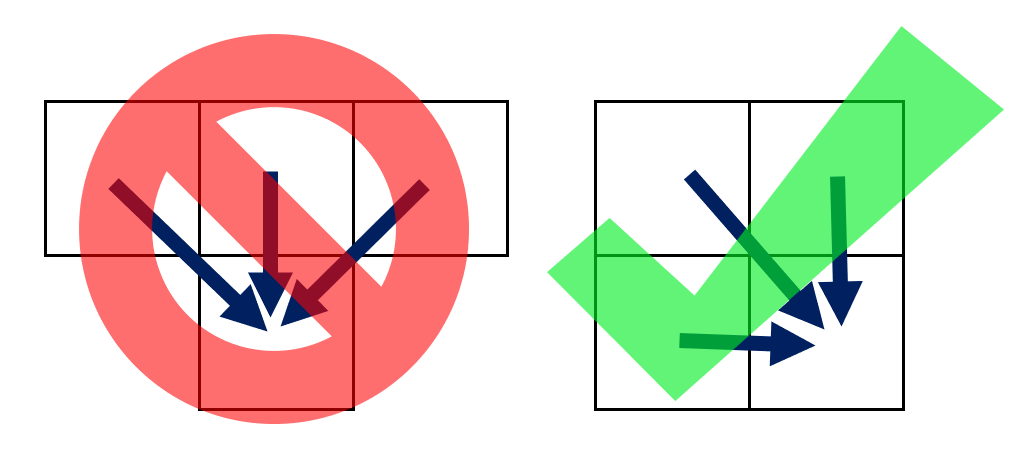
I was amused by the post 1-D Cellular Automata With a Twist, so I thought I'd take a look.
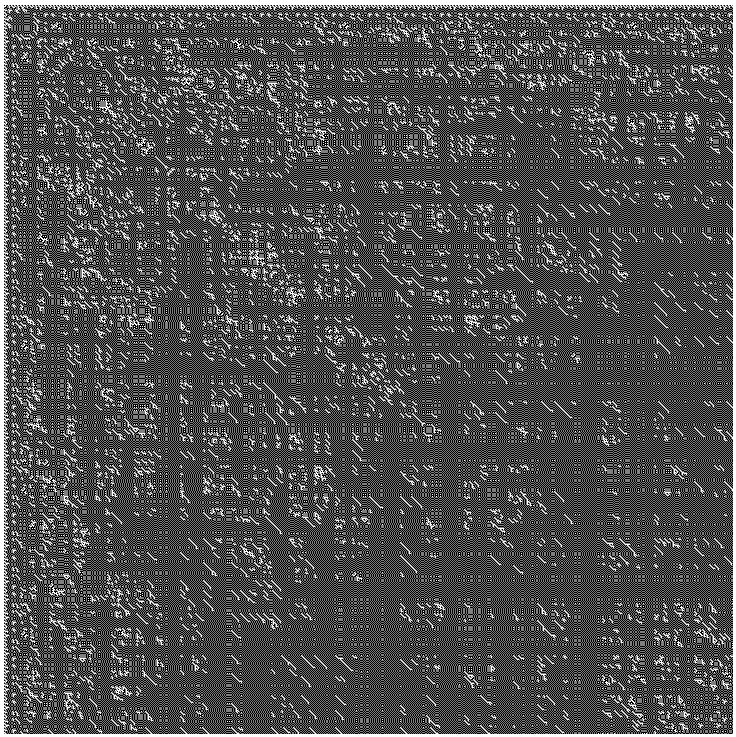
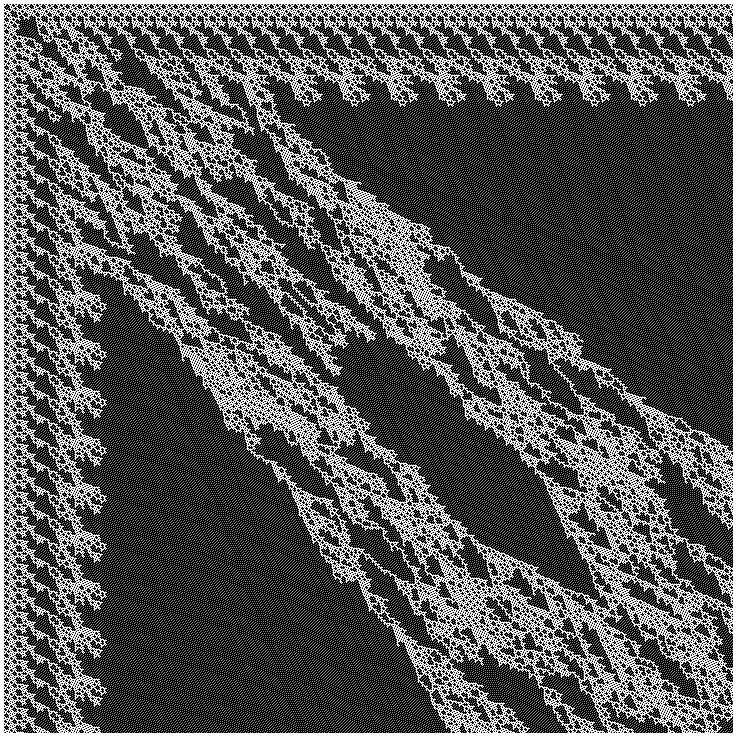
Here's rule 420.
Clear[a];
tab=Table[{a[0,k]=0, a[k,0]=0},{k,0,800}];
a[0,0]=1;
rule=IntegerDigits[420,3,7];
a[n_,k_] := a[n,k]= rule[[1+ a[n-1,k -1]+a[n -1,k]+a[n ,k-1]]];
tab=Table[a[m,d-m],{d,2,729},{m,1,d-1}];
ArrayPlot[Table[a[x,y],{x,1,729},{y,1,729}], Frame-> False, PixelConstrained->1]
Here are some other nice rules:
nice = {381, 382, 383, 384, 385, 386, 414, 415, 416, 417, 418, 419,
  420, 421, 422, 424, 478, 613, 622, 623, 624, 625, 626, 657, 658,
  663, 694, 717, 721, 864, 865, 866, 867, 868, 869, 870, 871, 872,
  883, 903, 904, 906, 936, 937, 960, 1110, 1111, 1112, 1113, 1114,
  1115, 1143, 1144, 1145, 1146, 1147, 1148, 1149, 1150, 1230, 1231,
  1232, 1233, 1234, 1235, 1236, 1237, 1238, 1239, 1240, 1242, 1243,
  1244, 1245, 1246, 1247, 1254, 1255, 1256, 1257, 1258, 1259, 1260,
  1261, 1262, 1263, 1265, 1266, 1272, 1274, 1278, 1279, 1280, 1284,
  1287, 1288, 1342, 1351, 1352, 1354, 1355, 1386, 1387, 1392, 1504,
  1527, 1531, 1539, 1547, 1548, 1549, 1556, 1557, 1558, 1559, 1560,
  1561, 1562, 1563, 1564, 1585, 1593, 1594, 1595, 1596, 1597, 1598,
  1599, 1600, 1601, 1608, 1612, 1632, 1633, 1634, 1635, 1666, 1774,
  1839, 1840, 1841, 1842, 1843, 1844, 1872, 1874, 1875, 1876, 1877,
  1878, 1879, 1882, 2071, 2080, 2081, 2082, 2083, 2084, 2121, 2175}
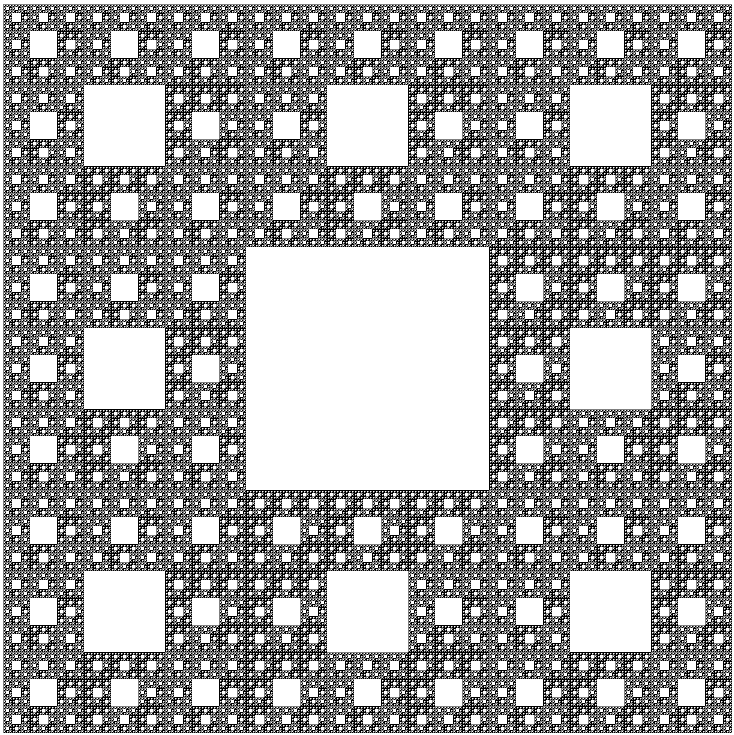
Here's 1504
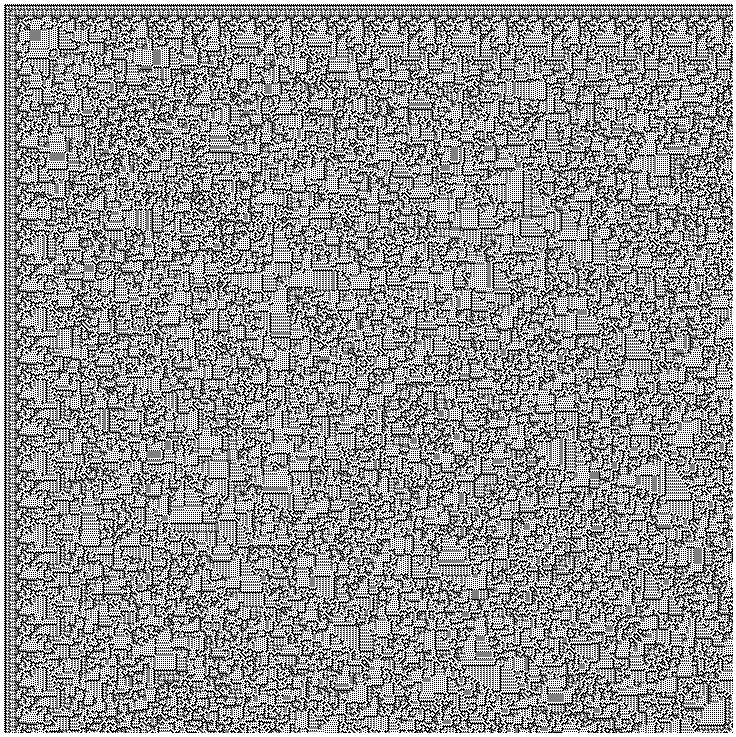
Here's 1240
Here's 1263