Dear Frank,
with a lot of inspiration from
Sjoerd C. de Vries 's beautiful post:
http://mathematica.stackexchange.com/questions/4017/computing-and-plotting-a-spectrogram-in-mathematicaI came up with the following, admittedly slightly clumsy code.
(*Take example sound data*)
snd = ExampleData[{"Sound", "SopranoSaxophone"}];
(*determine the sampling rate and number of points*)
sndData = snd[[1, 1, 1]]; sndSampleRate = snd[[1, 2]];
min = Min[Abs[Fourier[sndData]]];
(*Calculate the spectrogram*)
partSize = 2500;
offset = 250;
spectroGramData =
Take[20*Log10[Abs[Fourier[#]]/min], {2, partSize/2 // Floor}] & /@
Partition[sndData, partSize, offset];
revmatrix = Reverse[Transpose[spectroGramData]];
(*Generate the frames for the animation*)
listframes =
Table[MatrixPlot[revmatrix, ColorFunction -> "Rainbow",
DataRange ->
Round[{{0,
Length[sndData]/sndSampleRate}, {sndSampleRate/partSize,
sndSampleRate/2}}, 0.1], AspectRatio -> 1/2, ImageSize -> 800,
Frame -> True,
FrameLabel -> {"Frequency (Hz)", "Time (s)", "", ""},
BaseStyle -> {FontFamily -> "Arial", FontWeight -> Bold, 12},
Epilog -> {{Blue, Line[{{d, 0}, {d, sndSampleRate/2}}]}}], {d, 0,
N[Length[sndData]/sndSampleRate], 0.05}];
(*The sound keeps repeating after the animation is done, so we need to kill it with silence! *)
killsound :=
EmitSound[SampledSoundList[{0.}, 8000], "Preemptive"];
(*Make the animation from the fremes; don't use ListAnimte; If conditions start sound and kill it *)
Animate[
If [i == Length[listframes] || i == 1, killsound; listframes[[1]] ,
If[i > 1, EmitSound[snd]; listframes[[i]]]], {i, 1,
Length[listframes], 1}, AnimationRunning -> False,
DefaultDuration -> N[Length[sndData]/sndSampleRate],
AnimationRepetitions -> 1]
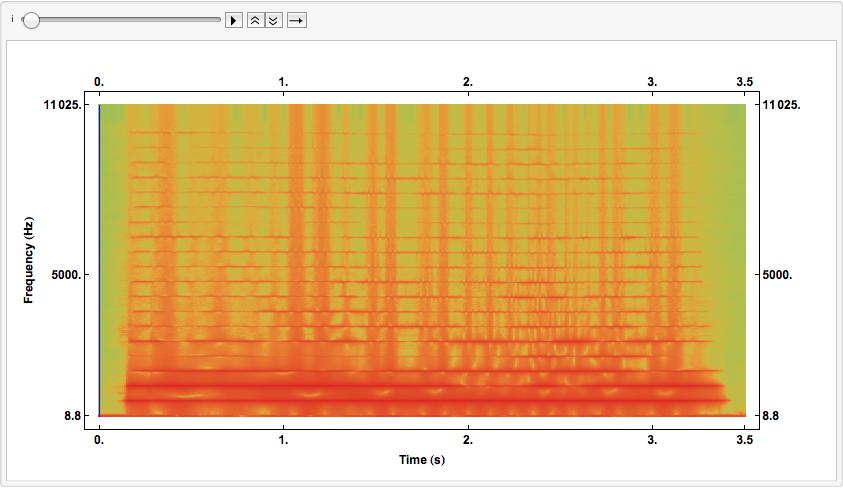
The interface looks like this:

Unfortunately, I cannot add animations to this post...
If you run the code, there should be a line moving over the picture to show where you are; and if everything works you hear the sound as well.
As you see, I need to generate the frames beforehand to make the video less sluggish. There is a lot to improve and fine-tune here, but perhaps it's a starting point. It should be quite clear how to put the waveform figure in. The most delicate point is the sync between the sound and the animation.
It also becomes quite clear now how to use the Mathematica function
Spectrogram to achieve the same effect. I can try to add an updated version tomorrow.
I hope that this helps you to find a solution,
Marco