Message Boards Message Boards

0
|
8582 Views
|
5 Replies
|
3 Total Likes
View groups...
Share
Share this post:

Can I display the position of what I hear using EmitSound[] ?

Hi,

I need to visually and acoustically analyze sounds of very different nature according to their overtone structure, which I display in form of spectrograms and waveforms (as it is done e. g. in  http://demonstrations.wolfram.com/AudioSpectrogram/).

For this purpose I currently use an audio editor (e. g. Amadeus Pro), where I can watch a cursor moving across the waveform and spectrogram plots while listening to the corresponding sound. This helps me a lot to identify particular sound characteristics (e. g. activation of formants in speech or singing).

Unfortunately, when playing  a sound in Mathematica using e. g. EmitSound[], I can only hear the sound, but I have not found a way to superimpose  the position of what is being played on the waveform and spectrogram in the UI object. 

Has  anybody done this in Mathematica already or would have suggestions on how to do this?

Best regards
Frank
POSTED BY: Frank Scherbaum
5 Replies
From a practical perspective, the easiest way to do this would be to use an external program to play the sound, and invoke the external program from Mathematica.  For example, on Windows, foobar2000 can be set up to display a nice spectrogram while playing, and indicate the current position within the visualization.

You could create a Mathematica command which will first export the sound to a temporary location, then open it using the external player.  It might be as simple as using Export and SystemOpen if the player is already the default application for sounds.

I know that this is not the ideal solution, but I think it's going to be the most practical one that will take the least of your time for setting up.  I doubt that it's possible to implement a convenient solution all within Mathematica.
POSTED BY: Szabolcs Horvát
Dear Frank,

with a lot of inspiration from Sjoerd C. de Vries 's beautiful post:
http://mathematica.stackexchange.com/questions/4017/computing-and-plotting-a-spectrogram-in-mathematica

I came up with the following, admittedly slightly clumsy code. 
 (*Take example sound data*)
 snd = ExampleData[{"Sound", "SopranoSaxophone"}];
 
 (*determine the sampling rate and number of points*)
 sndData = snd[[1, 1, 1]]; sndSampleRate = snd[[1, 2]];
 
 min = Min[Abs[Fourier[sndData]]];
 
 (*Calculate the spectrogram*)
partSize = 2500;
offset = 250;
spectroGramData =
  Take[20*Log10[Abs[Fourier[#]]/min], {2, partSize/2 // Floor}] & /@
   Partition[sndData, partSize, offset];
revmatrix = Reverse[Transpose[spectroGramData]];

(*Generate the frames for the animation*)
listframes =
  Table[MatrixPlot[revmatrix, ColorFunction ->  "Rainbow",
    DataRange -> 
     Round[{{0,
        Length[sndData]/sndSampleRate}, {sndSampleRate/partSize,
        sndSampleRate/2}}, 0.1], AspectRatio -> 1/2, ImageSize -> 800,
     Frame -> True,
    FrameLabel -> {"Frequency (Hz)", "Time (s)", "", ""},
    BaseStyle -> {FontFamily -> "Arial", FontWeight ->  Bold, 12},
    Epilog -> {{Blue, Line[{{d, 0}, {d, sndSampleRate/2}}]}}], {d, 0,
    N[Length[sndData]/sndSampleRate], 0.05}];

(*The sound keeps repeating after the animation is done, so we need to kill it with silence! *)
killsound :=
EmitSound[SampledSoundList[{0.}, 8000], "Preemptive"];

(*Make the animation from the fremes; don't use ListAnimte; If conditions start sound and kill it *)
Animate[
If [i == Length[listframes] || i == 1, killsound; listframes[[1]] ,
  If[i > 1, EmitSound[snd]; listframes[[i]]]], {i, 1,
  Length[listframes], 1}, AnimationRunning -> False,
DefaultDuration -> N[Length[sndData]/sndSampleRate],
AnimationRepetitions -> 1]

The interface looks like this:


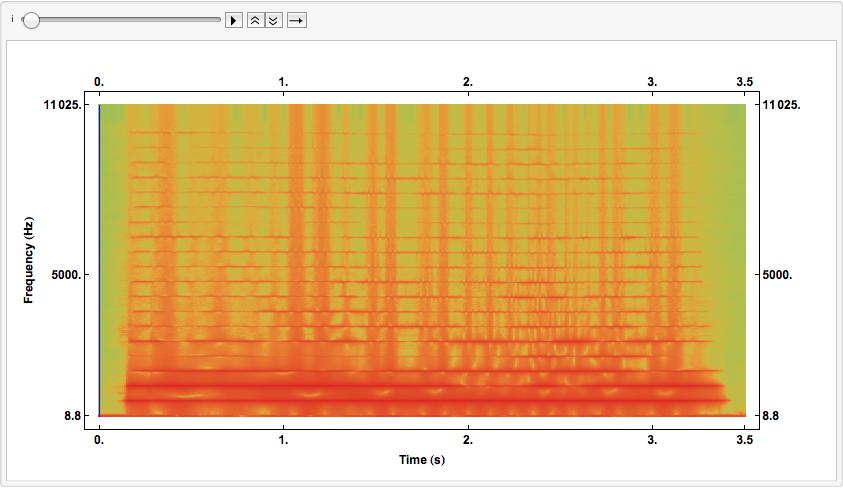
Unfortunately, I cannot add animations to this post...
If you run the code, there should be a line moving over the picture to show where you are; and if everything works you hear the sound as well.

As you see, I need to generate the frames beforehand to make the video less sluggish. There is a lot to improve and fine-tune here, but perhaps it's a starting point. It should be quite clear how to put the waveform figure in. The most delicate point is the sync between the sound and the animation. 

It also becomes quite clear now how to use the Mathematica function Spectrogram to achieve the same effect. I can try to add an updated version tomorrow.

I hope that this helps you to find a solution,
Marco
POSTED BY: Marco Thiel
That's a nice implementation Marco!

I think that the main problem with a generally usable Mathematica implementation is going to be that there's no way to guarantee that the animation and the sound stay synchronized.
POSTED BY: Szabolcs Horvát
Dear Marco,

that´s really very helpful and a good starting point.  I forgot to say that I want to put the "sounding spectrogram" into a CDf file. Seeing your soulution,  I am wondering if I should simply generate a movie file from the animation of the spectrogram on which the moving vertical line is superimposed and then add the sound trace to the video.  
Andrew Moylan´s blog  http://blog.wolfram.com/2011/07/15/mathematica-qa-creating-movie-files/ covers the video aspect of generating movies but it is not clear to me how I can add a sound trace to that. 

Any idea?

I am really curious to see the results of your use of the Spectrogram function to get the same effect.
Frank
POSTED BY: Frank Scherbaum
Dear Frank, 

I have had no luck yet with exporting the video. I only managed it by exporting the sound and the animation separately and then using another program to align and combine both.
I see that you have posted another question regarding this issue. I would be great if somebody knew the answer...

Marco 
POSTED BY: Marco Thiel
Reply to this discussion
Community posts can be styled and formatted using the Markdown syntax.
Reply Preview
Attachments
Remove
or Discard

Group Abstract Group Abstract