MODERATOR NOTE: coronavirus resources & updates: https://wolfr.am/coronavirus Wolfram Notebook of this post is attached at the bottom.
All around the world people are discussing whether their country is taking the right measures to fight the Corona virus. This far my country Sweden has taken relatively mild restrictions compared to other European countries. For instance, restaurants, schools, and boarders have not been closed (until the European Union closed them at least). This upsets many, claiming that we do too little. Therefore, I thought I would make some quick analysis to see how we are actually doing compared to other countries. For this purpose I used the data repository, plot, and manipulate.
Comparing cases of COVID-19 by country
I made it possible to select up to five countries and plot any of the number of cases, deaths or recovered in either a logarithmic or linear scale:
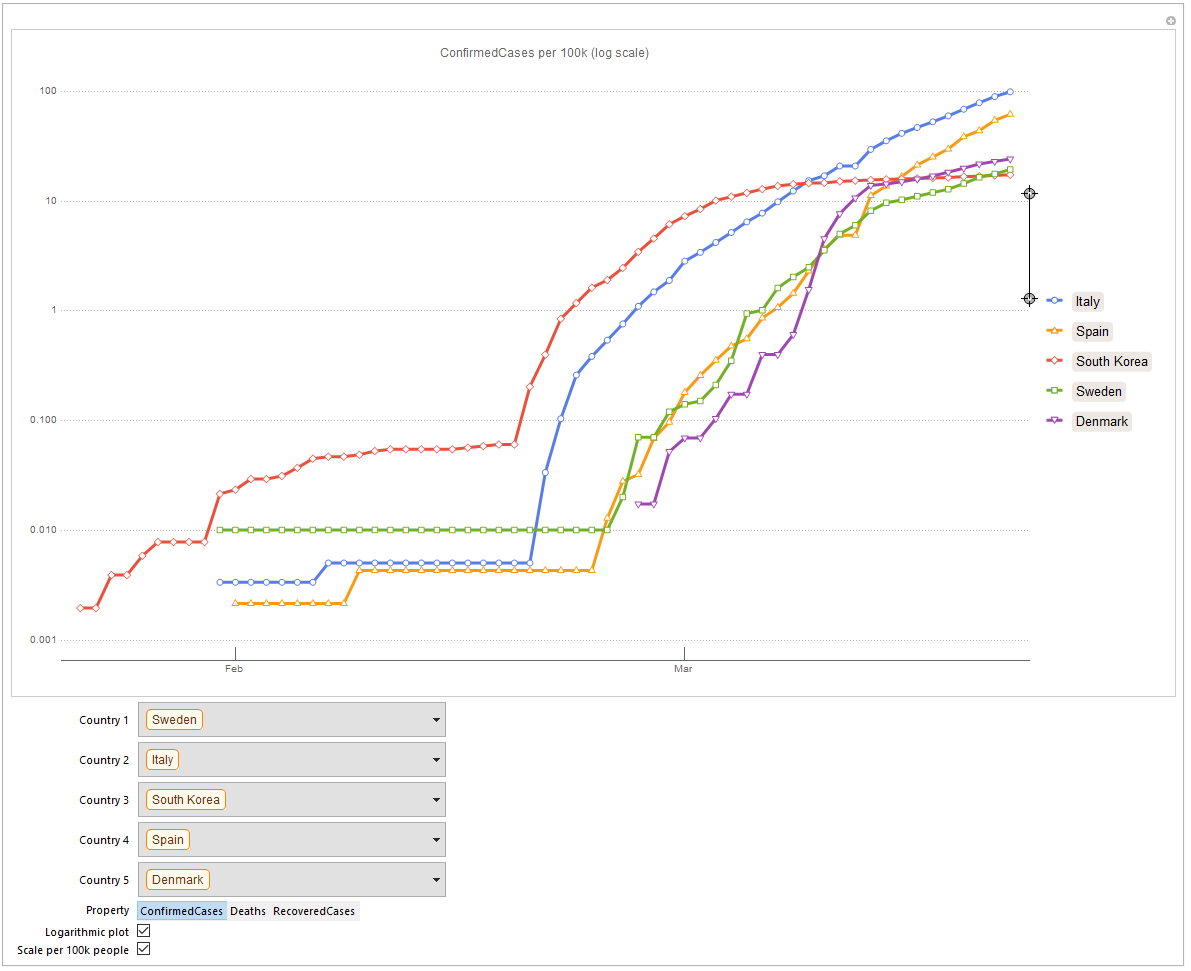
When comparing number of reported cases between the five countries, it is easy to see that Italy and Spain have worse problems than the three others. But interestingly enough all, except for possibly Spain, follow similar patterns and all are flattening out, i.e. getting closer to a steady rather than an exponential growth. This is true even for Italy, even though they are at much higher levels. South Korea looks a bit different in two ways. They managed to stabilize the growth in an early phase, then they had a sudden growth (caused by the so called Patient 31). As most know, they have managed to stabilize after that again, which is clearly seen in the curve.
A lot of discussion in all countries has been about how fast the countries reacted to it and which measures were taken. Basically there are three phases, during the first phase there is no spread (flat curve), then the spread starts to grow, and finally it will flatten out.
The second stage is possible to split in different sub stages. If a country misses the start of the outbreak then the curve will stay flat until they actually start testing. At this point there will be a sudden increase as (some) of the early infected are suddenly infected, then it will flatten out somewhat (and even more after measures such as social distancing and improved hygiene is introduced). By drawing the tangent from this second part of the second phase and seeing where it intersects with stage 1 you will get an estimate of the (maximum) delay.
Perhaps you noticed the two locator just above the legend in the previous plot? I added those, so you can move around and place a line like this: 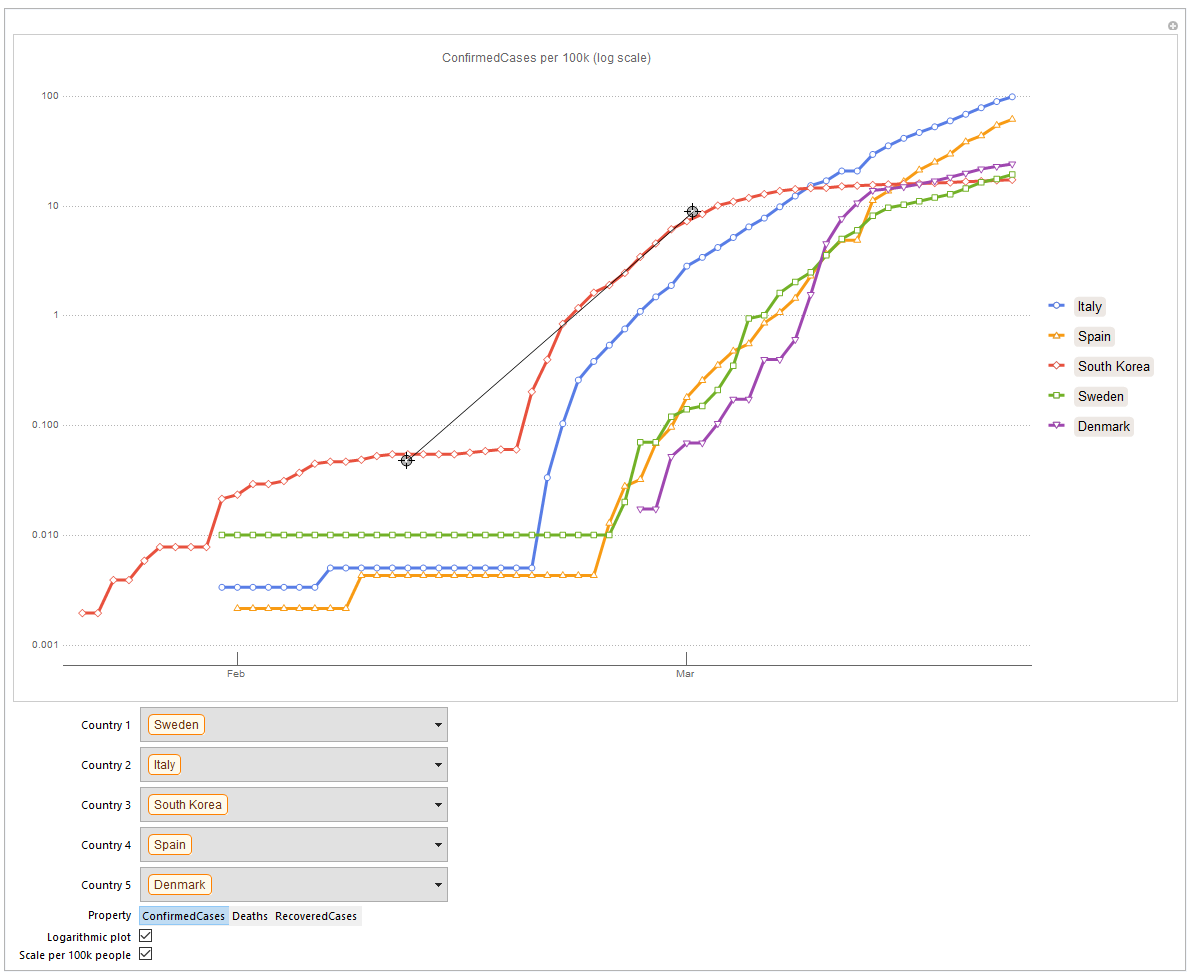
You can drag the locators your self to Check Italy's and Sweden's value. Here are my conclusions from this quick analysis:
- Italy missed it completely (up to 14 says)
- South Korea did very well, but it looks like they missed patient 31 with up to 7 days
- Finally, Sweden were almost spot on
This is important as the ability to react early means that you can take much milder actions to fight outbreak. It is all about the right measures at the right time.
Comparing the Nordic countries
Relating to that, here in Sweden a lot of people have been complaining that we are not doing enough compared to our neighbors. For instance, we have not closed schools (high school and universities recently went to remote teaching though), restaurants, or borders (until now when the EU decided to do so). It is also still allowed to have crowds of up to 500. All our neighbors have introduced more restrictions, so one might expect us to do worse:
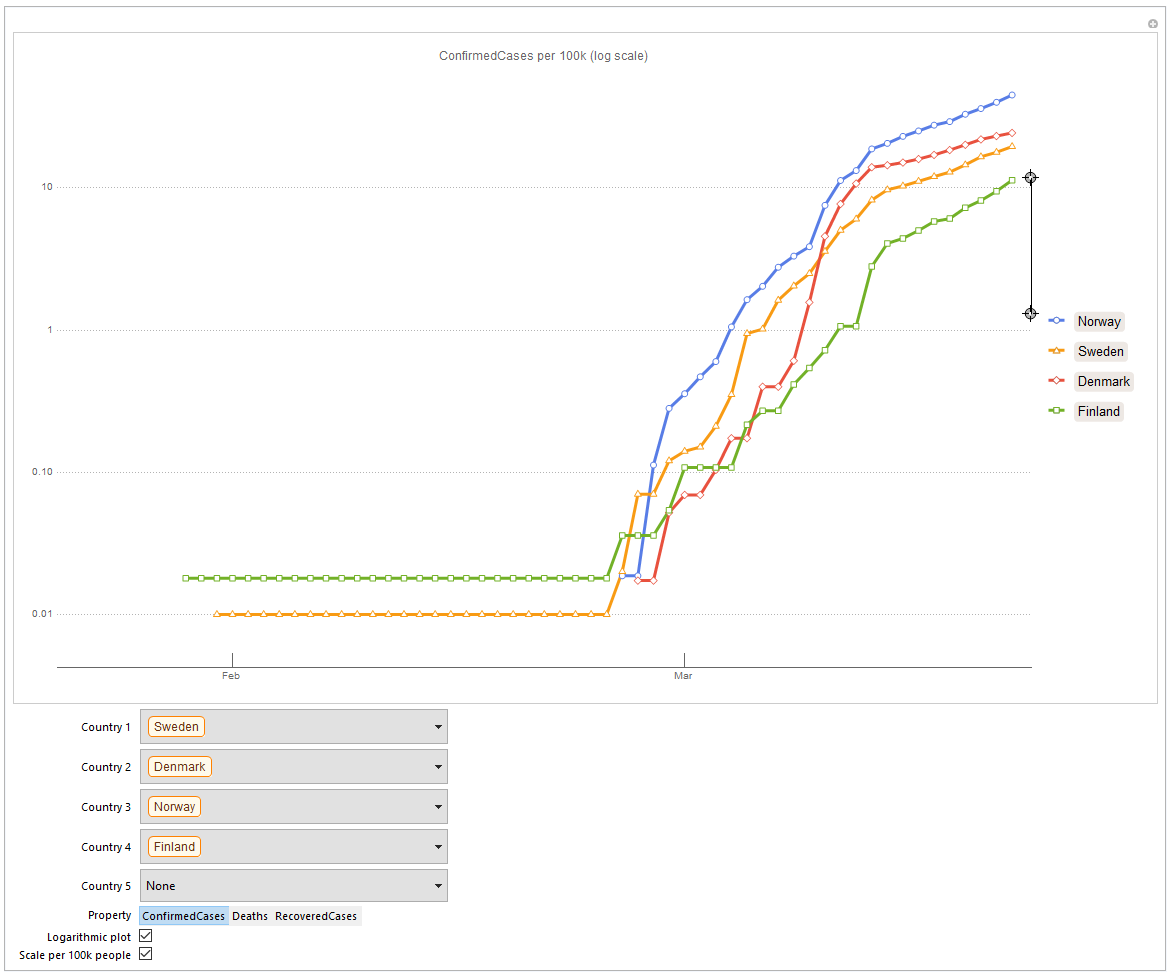
Finland is obviously doing best this far and Noways worst. Between them we have Denmark and Sweden. So, despite taken less aggressive measures than our two western neighbors we are doing better then them, especially Norway. If you change to a logarithmic plot (click the checkbox at the bottom) you can see that it looks like Norway missed the start of the outbreak. This is probably an important reason for their problems and caused them to close more than Sweden. As I do not know which measures that has been taken on Iceland, I opted not to add them in the plot. Of course you can easily do that (unfortunately they are doing worse as it looks like)
On the positive side all four countries, except possibly Norway, look like they might be getting close to get the curve to flat out. This is very early stage and as test strategies have changed in at least Denmark and Sweden lately this might be misleading. In a few days this should be clearer.
Of course, as shown in the graph for South Korea, anything can happen. Just because you look like you are in control at the moment does not mean that you are tomorrow. Something or someone, like patient 31, might slip through and suddenly it grows faster again. But, yet again, looking at South Korea it turns out that as long as you act in time you can still control it.
I would encourage you to add Japan to the plots and look at their progress. They are clearly able to follow a completely different pattern than the rest with a much smaller rate growth. The question is if they will manage to stay strong and keep their measures for enough time and at which costs this comes to society?
Looking at China
China is a huge country so let us look at China by province. The spread started in the city of Wuhan in the province of Hubei which is represented by the blue line on top:
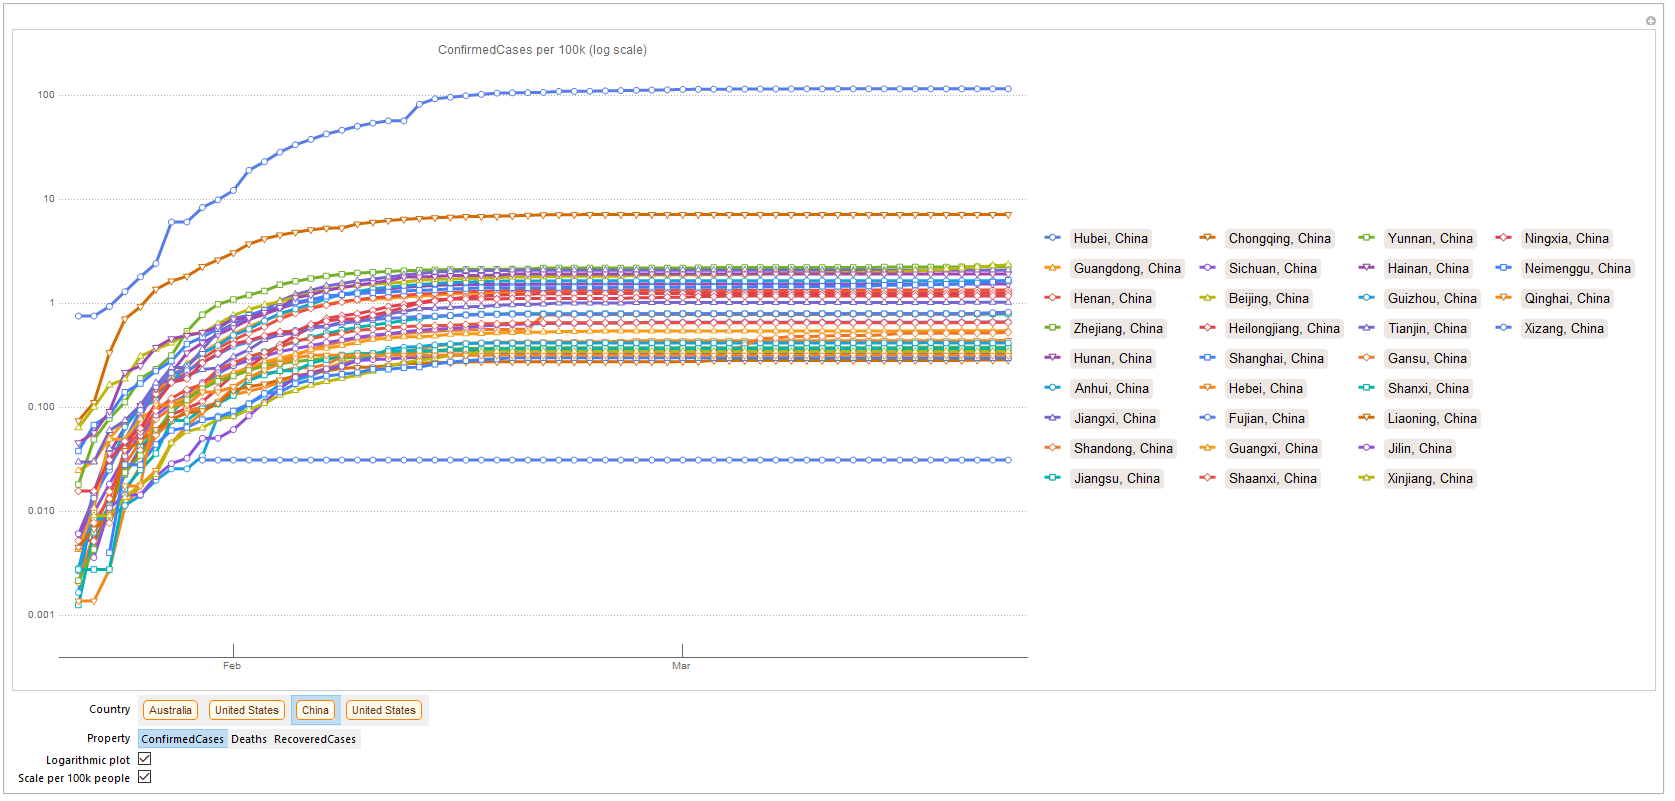
It looks like China has done a great job. Part of this is probably because you can take a lot of measures in China that you cannot take in a democracy. Furthermore, I would expect this data to be fake to be "adjusted" to have a nice message to give the world. For instance, I doubt that all provinces would reach a completely flat curve with no distortions.
As you may have noticed you can do the same plot for a three other countries, by clicking on respective country name.
Death rate
Through all this I have been looking at confirmed cases rather than death rate, at the end of day avoiding people dying is what it is all about. There's a couple of reasons why I have been focusing on confirmed case:
- There is a lag as it takes several days before someone that catches COVID-19 might die, so there is a delay in that data.
- Far from everyone that gets infected dies, therefore the death rate will probably have more noise in the initial period.
That said, this is how it looks like for Italy (in this case I chose a linear scale, but you can easily switch if you download and run the Notebook):
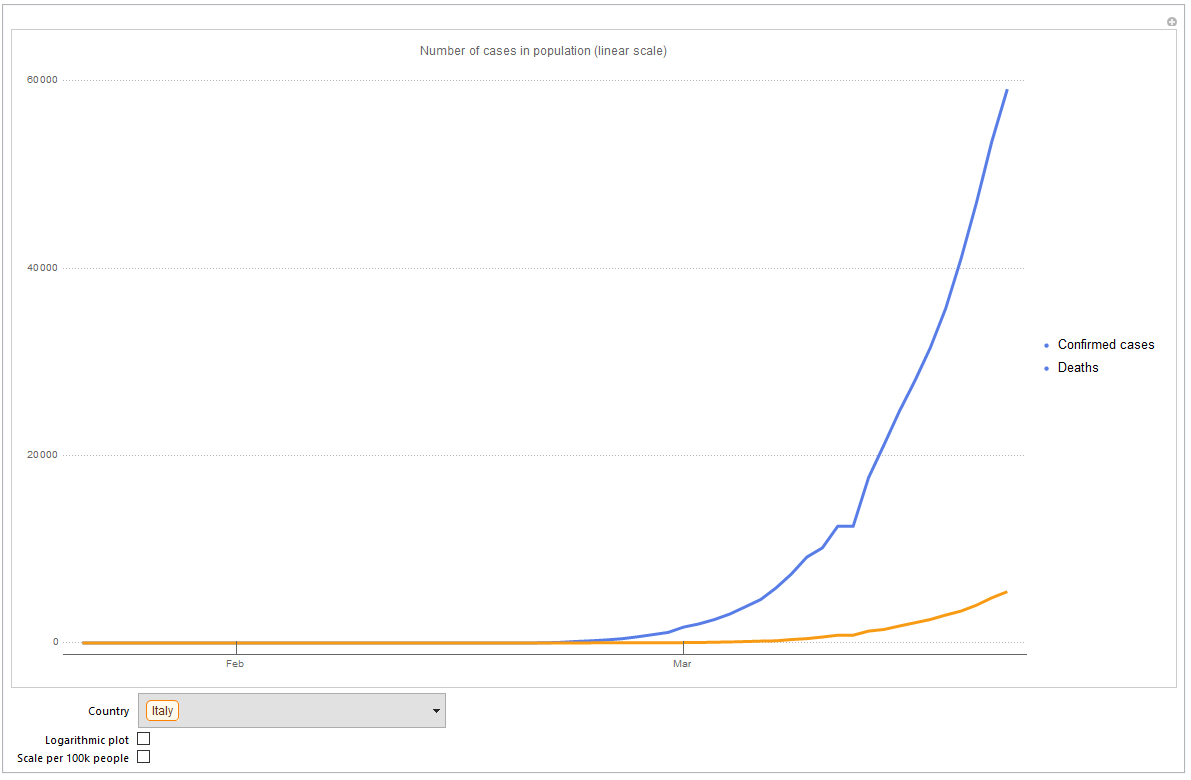
Finally, remember that each country is different: The Netherlands is much more dense than Norway, healthcare systems differ, and compared with Italians, Swedes and Finns keep a social distance by design. As the head of our Public Health Agency, Anders Tegnell, said: "We are quite boring, and that might work to our advantage in this case". These, and many other factors ,makes each country unique, so what works in one country might not work in the other.
Keep calm and carry on!
 Attachments:


